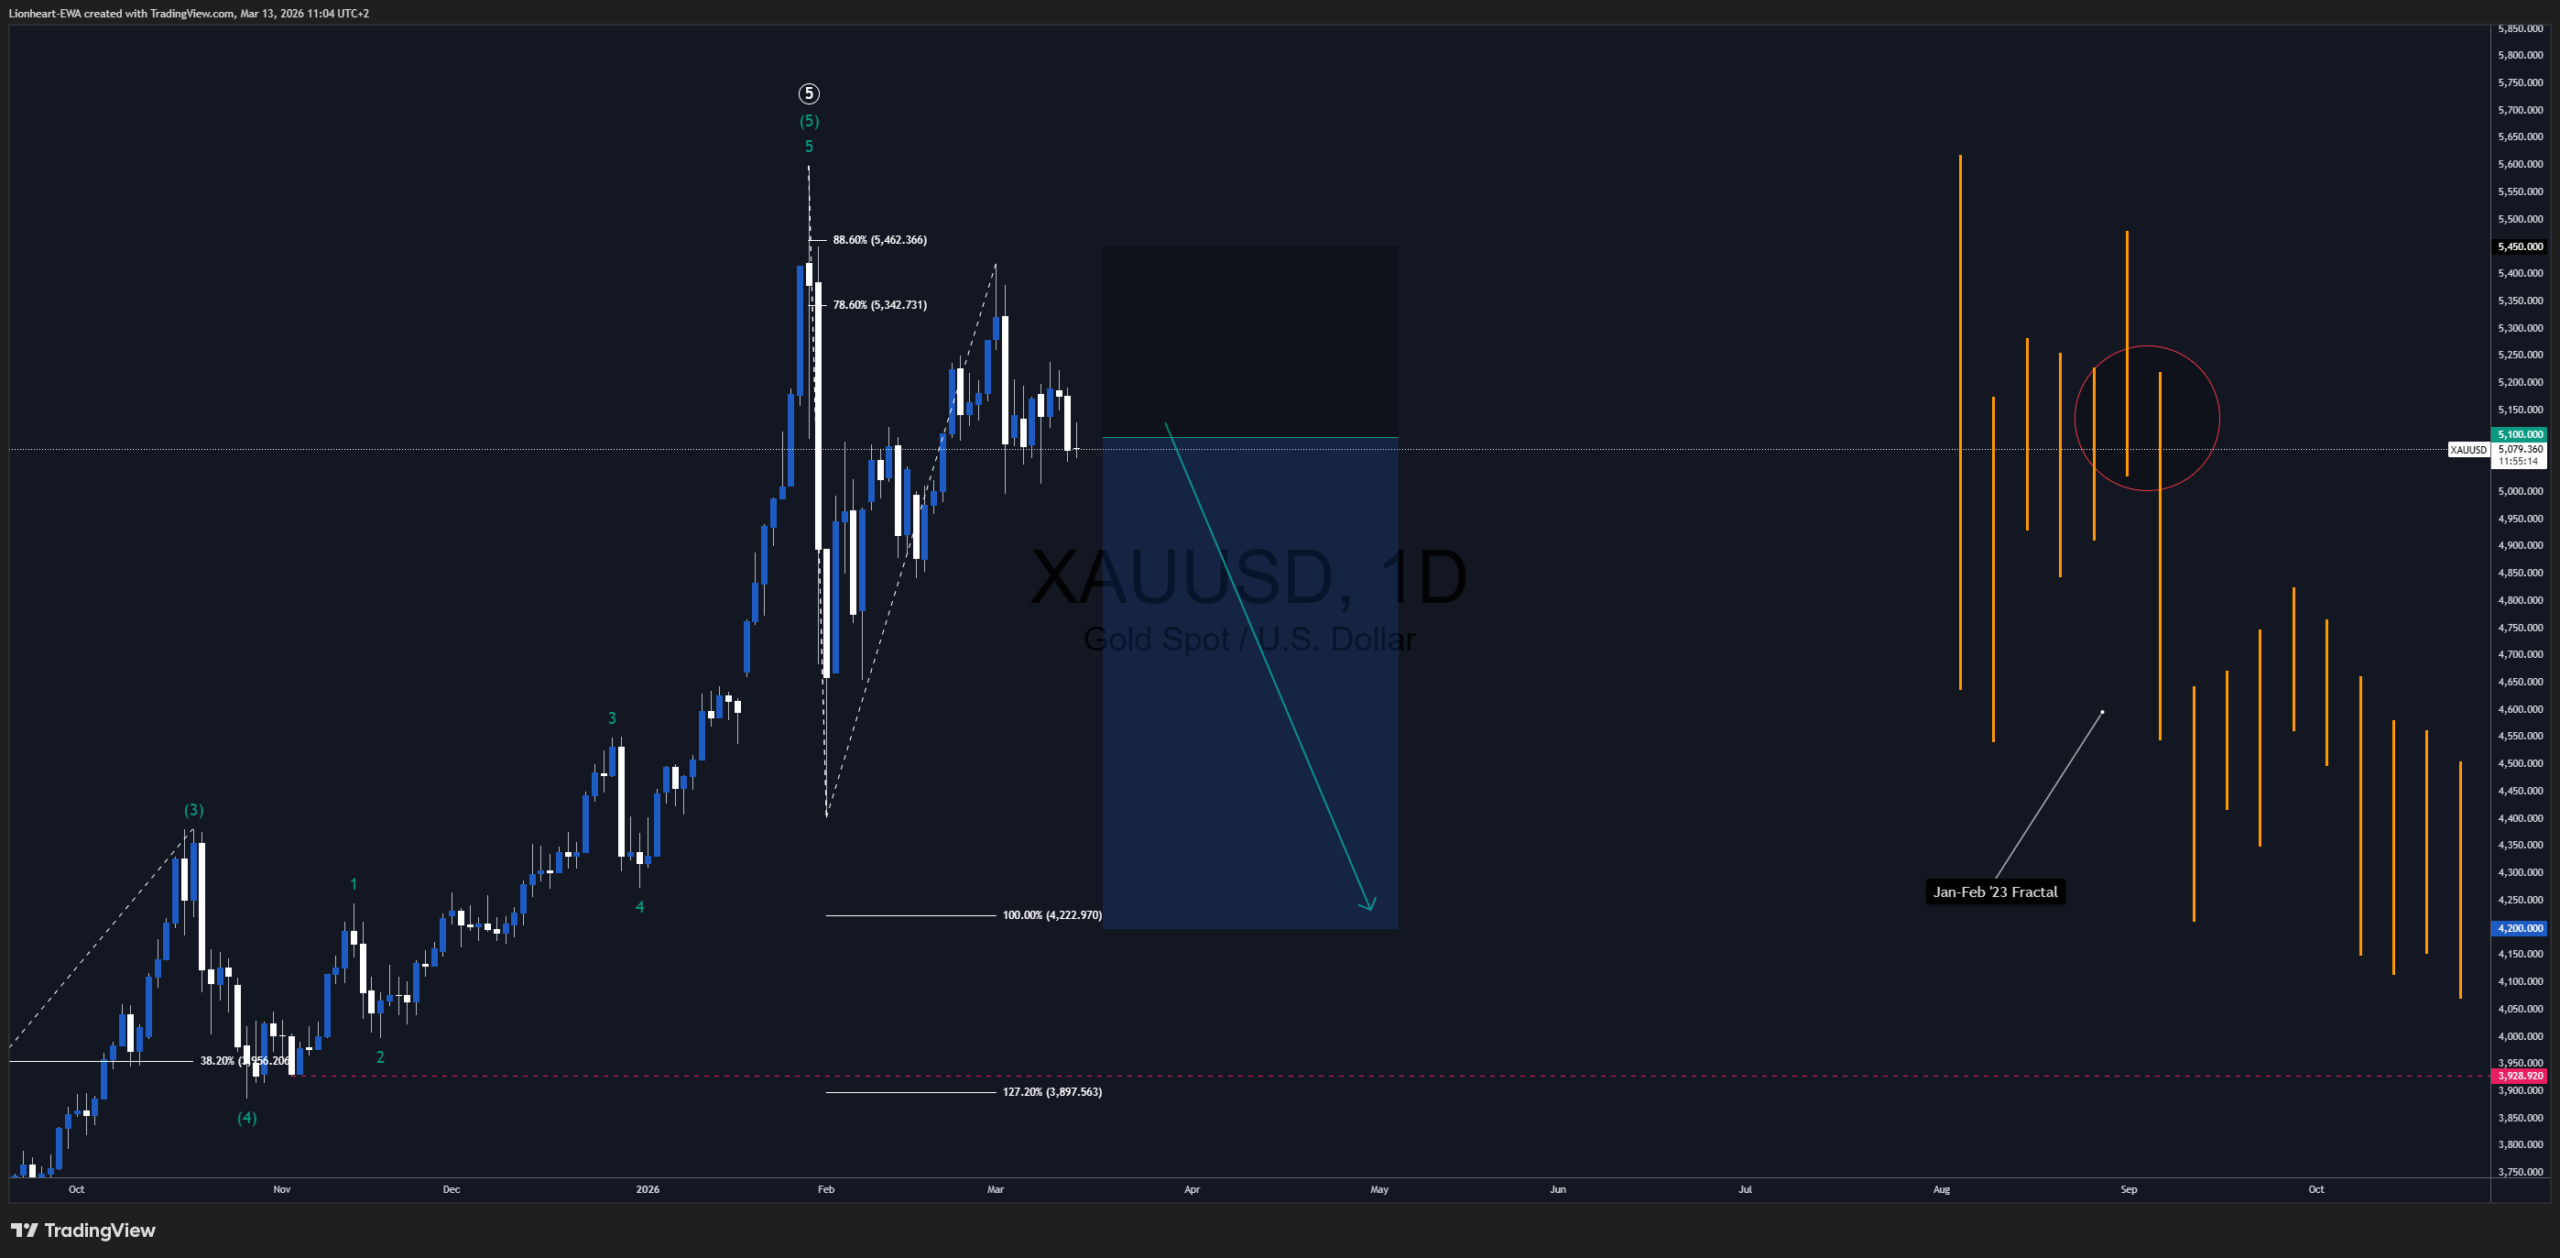
adminlewa March 13, 2026 3 Comments Gold-Trade-Signal Short FEDElliott Wave Tech. Analysis XAU/USD - Daily ChartSummaryGold-Trade-SignalXAUUSD (Gold) hit the ATH at $5598, then crashed to $4402.That’s the first leg of a deeper correction.There’s more downside.Tech. AnalysisGold ShortChart StructureElliott Wave A-B-CZig-Zag Pattern78.6-88.6% Fibonacci RetracementJan-Feb ’23 Fractal SequenceExpectationBearish Impulse in Wave C100-127.2% Fibonacci Extension of A-B Waves$4200 Target PriceGold (XAUUSD)Trade LevelsTicker: XAU/USDDirection: SHORTEntry @ $5100SL@ $5450TP @ $4200 Trade-Signals are subject to risk, DYOR. Lionheart EWATailored Trade Service Trading View Telegram Get Premium go pro Post Tags :#ElliottWave#GoldTradeSignal#Lionheart-EWA#TradingSignal#XAUUSDTradingSocial Share :


3 Comments
adminlewa
March 20, 2026Gold dropped $500 so far, on the FED Meeting event.
https://s3.tradingview.com/snapshots/z/ZKRdqOad.png
adminlewa
March 21, 2026XAUUSD crashing in an Impulse.
https://s3.tradingview.com/snapshots/n/Np4ofpA6.png
adminlewa
March 23, 2026GOLD TRADE SIGNAL:
TARGETS REACHED!
9000 POINTS.
https://s3.tradingview.com/snapshots/h/hpWAjhSN.png