

CBOE (VIX) – Volatility Index – Pointing towards a Market Crash?
It is without a doubt that the Stock Market has been trading within a Bull Market for the last 100 years and the past Recessions and Crashes acted as necessary Contractions in order for the Dominant Trend to unfold.
2018 has ended with the Volatility peaking at record lows, which means that Market Participants seem to be blinded by the buying euphoria, being complacent and thinking that tomorrow would be just like yesterday.
Technically speaking, some Analysts would notice that this is not really a good sign, on the contrary.
Another way of seeing the current Rallies in Global Equities could be a possible red flag, in which Investors seem to be sleep-walking towards the edge of the cliff.
Of course, this is a delicate subject and you could be asking me why I am thinking like this when there are clear signs of a healthy and ongoing Global Economy and Stock Markets creating new All Time Highs almost on a daily basis.
Let me walk you through this theory!
What I’m about to say and show you is to be treated as a simple market commentary and not as a solicitation to trade or as an immediate investment advice. Please remember this, thanks.
Dow Theory
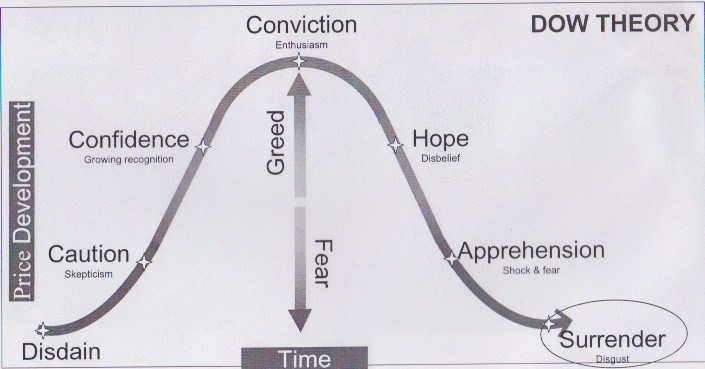
The Market’s Price Action movements represent Investor’s emotions and reactions. It’s a natural process which is somehow programmed by mathematics (Fibonacci).
This concept is coming from the founder of modern technical analysis himself, Mr. Charles Dow.
Picture above illustrates how these emotions unfold in the overall price developments.
R.N. Elliott took this concept even further and expanded his senses. He developed the precious Wave Principle, in which he proved that these buying/selling emotions could be measured and predicted by using the Fibonacci Sequence (Golden Ration) and the Fractal Pattern.
Elliott Wave Theory
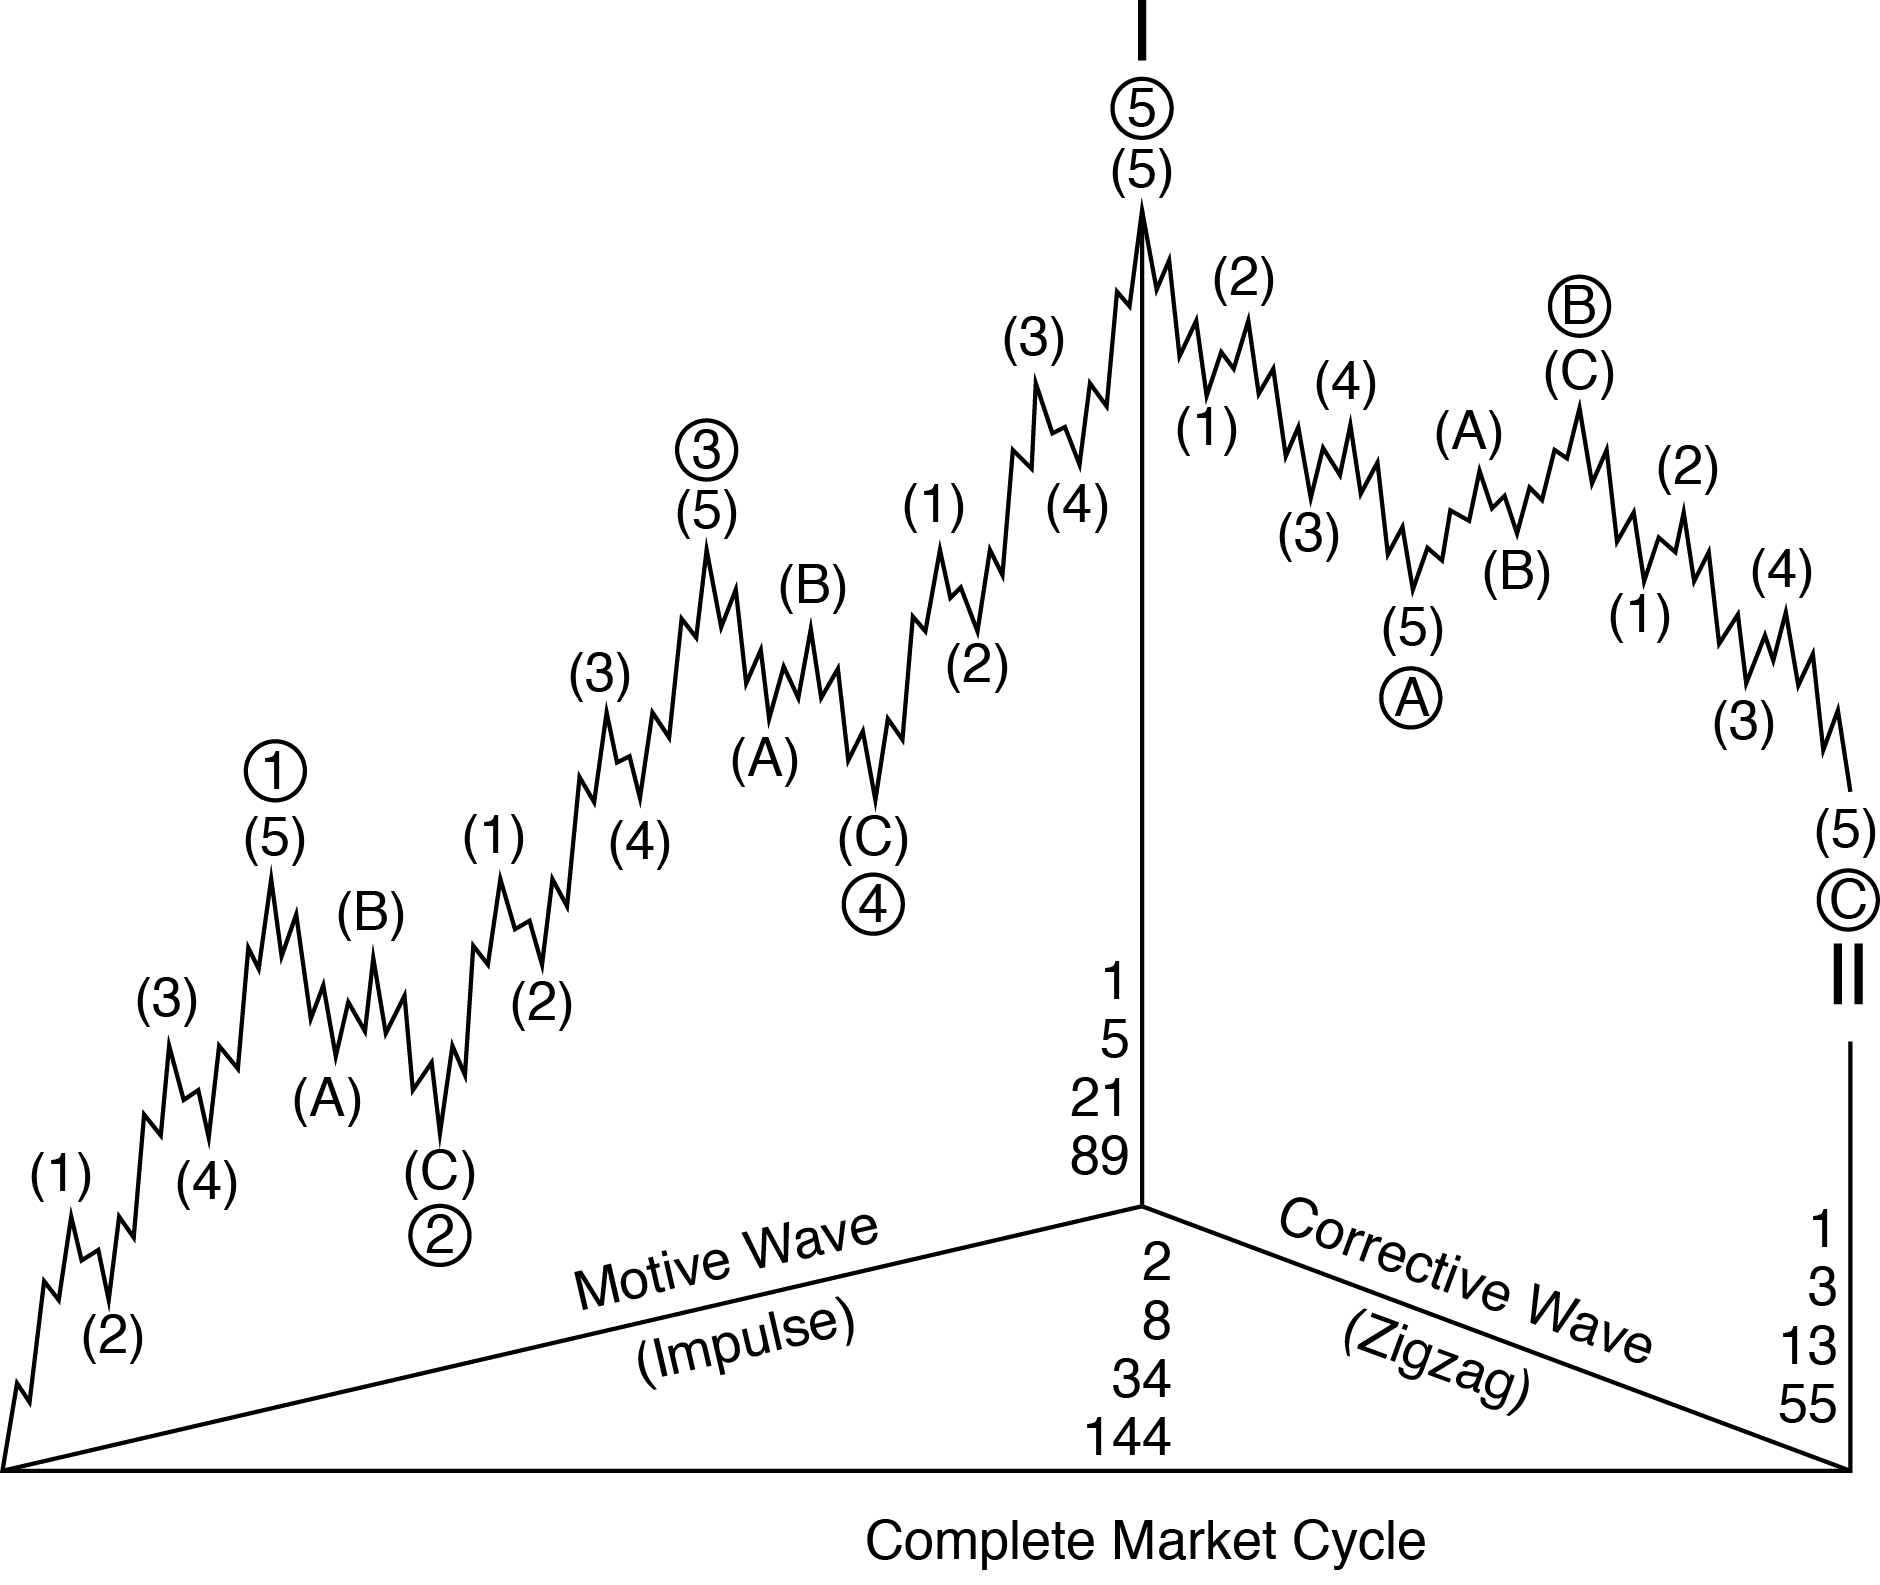
Elliott Wave Counts, Degrees and Time Cycles all technically point towards the possibility of something greater lurking around the corners.
US, EU, Asian Indices all seem to line-up for a possible Global Contraction.
What could cause this?
No clear idea! Could be anything.
We have debts reaching record highs globally, we have negative interest rates globally and we have low inflation with rising FED rates on top of all this.
Then we have great leaders who treat a nuclear issue as an opportunity to make a tweet.
We have countries wanting to leave the EU and political uncertainties, not to mention geo-political events or the fight over who dominates the oil industry.
CBOE (VIX) Volatility Index

In brief, VIX is used by Traders as a Fear/Green indicator, when it goes up it means that people are afraid because the Markets keeps on going down, and when it decreases it means that they are complacent and euphorically buying.
Anything below 10 reading is not good for those who are monitoring VIX.
As you can see from the Monthly Chart above, the historical Dot Com Bubble has shown the lowest point in Jan 1994 and then Fear kicked it.
Then, in Jan 2007 another low was created and Greed sentiment was quickly swallowed by investor’s Fear.
On Sep 2017 VIX witnessed another low, the lowest actually, followed by what appears to be a dangerous rise, happening now in Jan-Feb 2018.
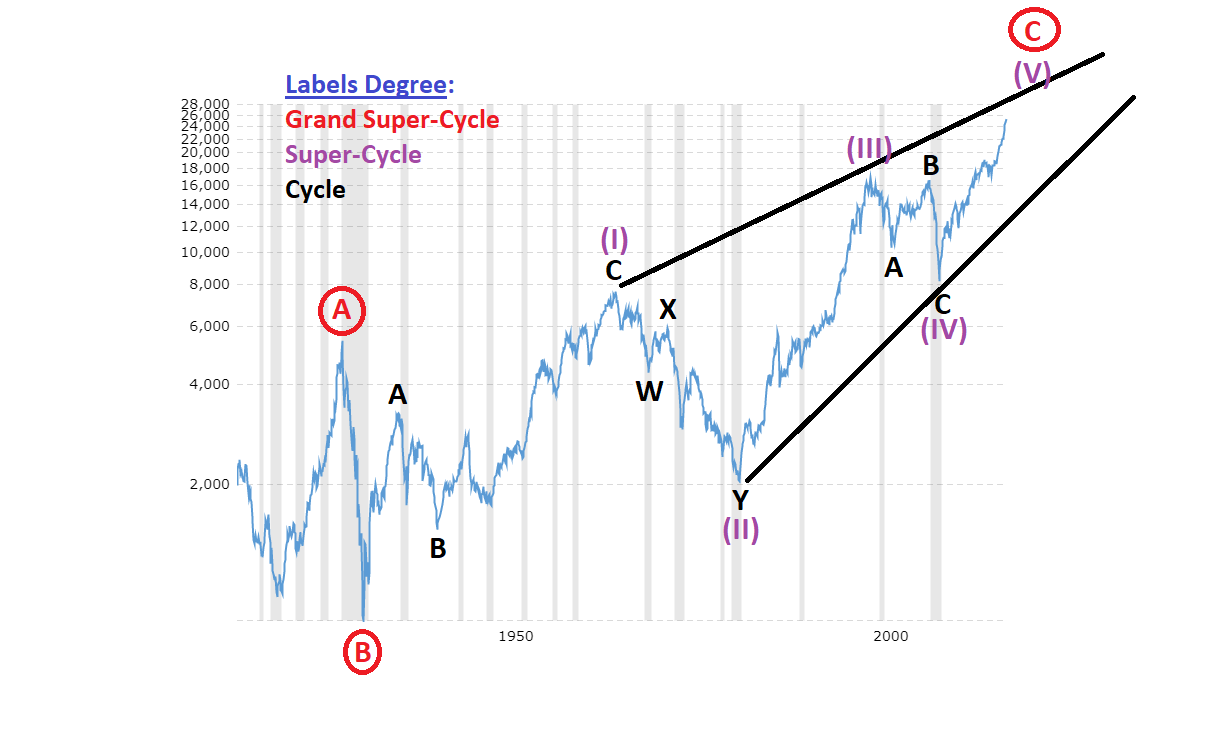
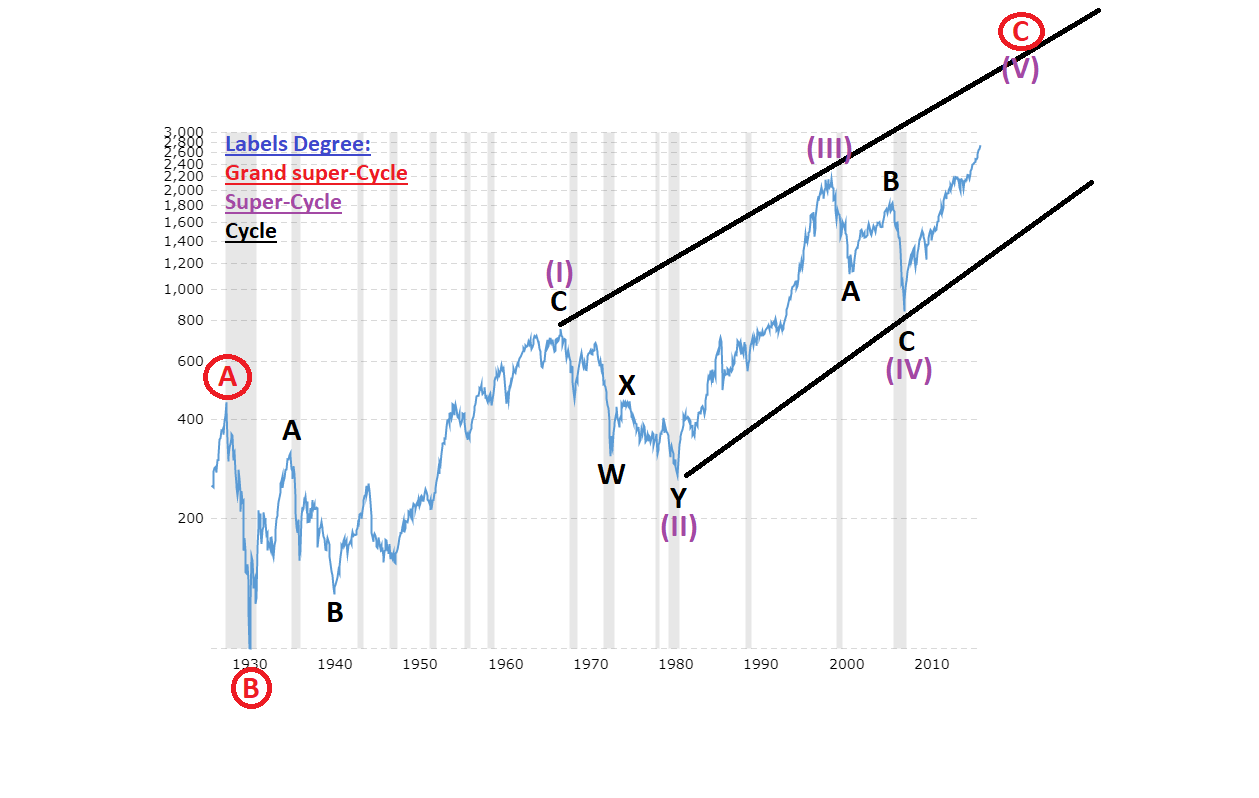
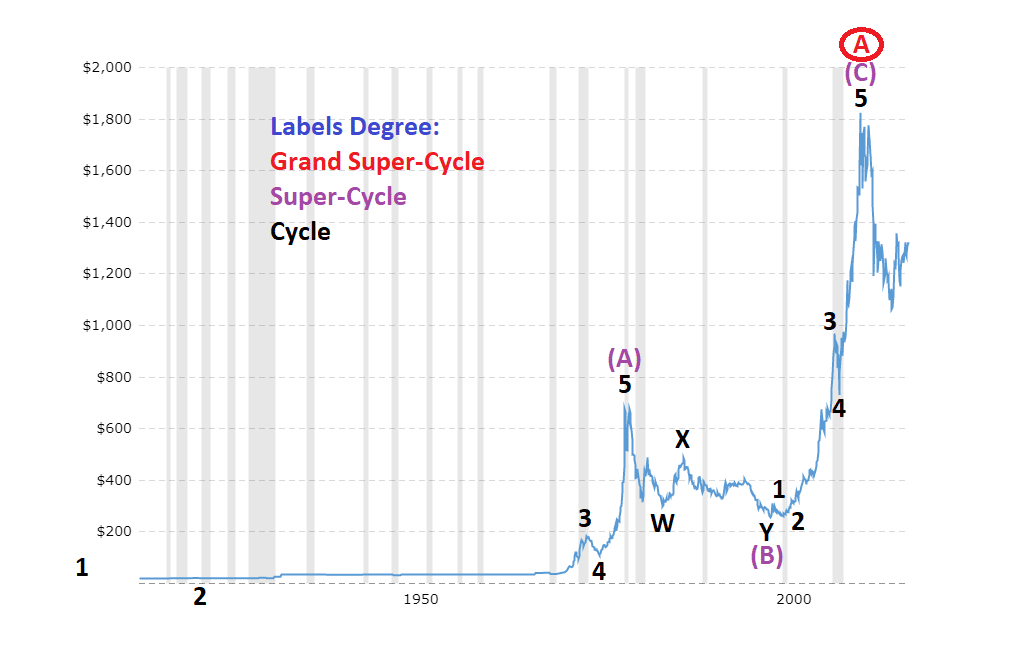
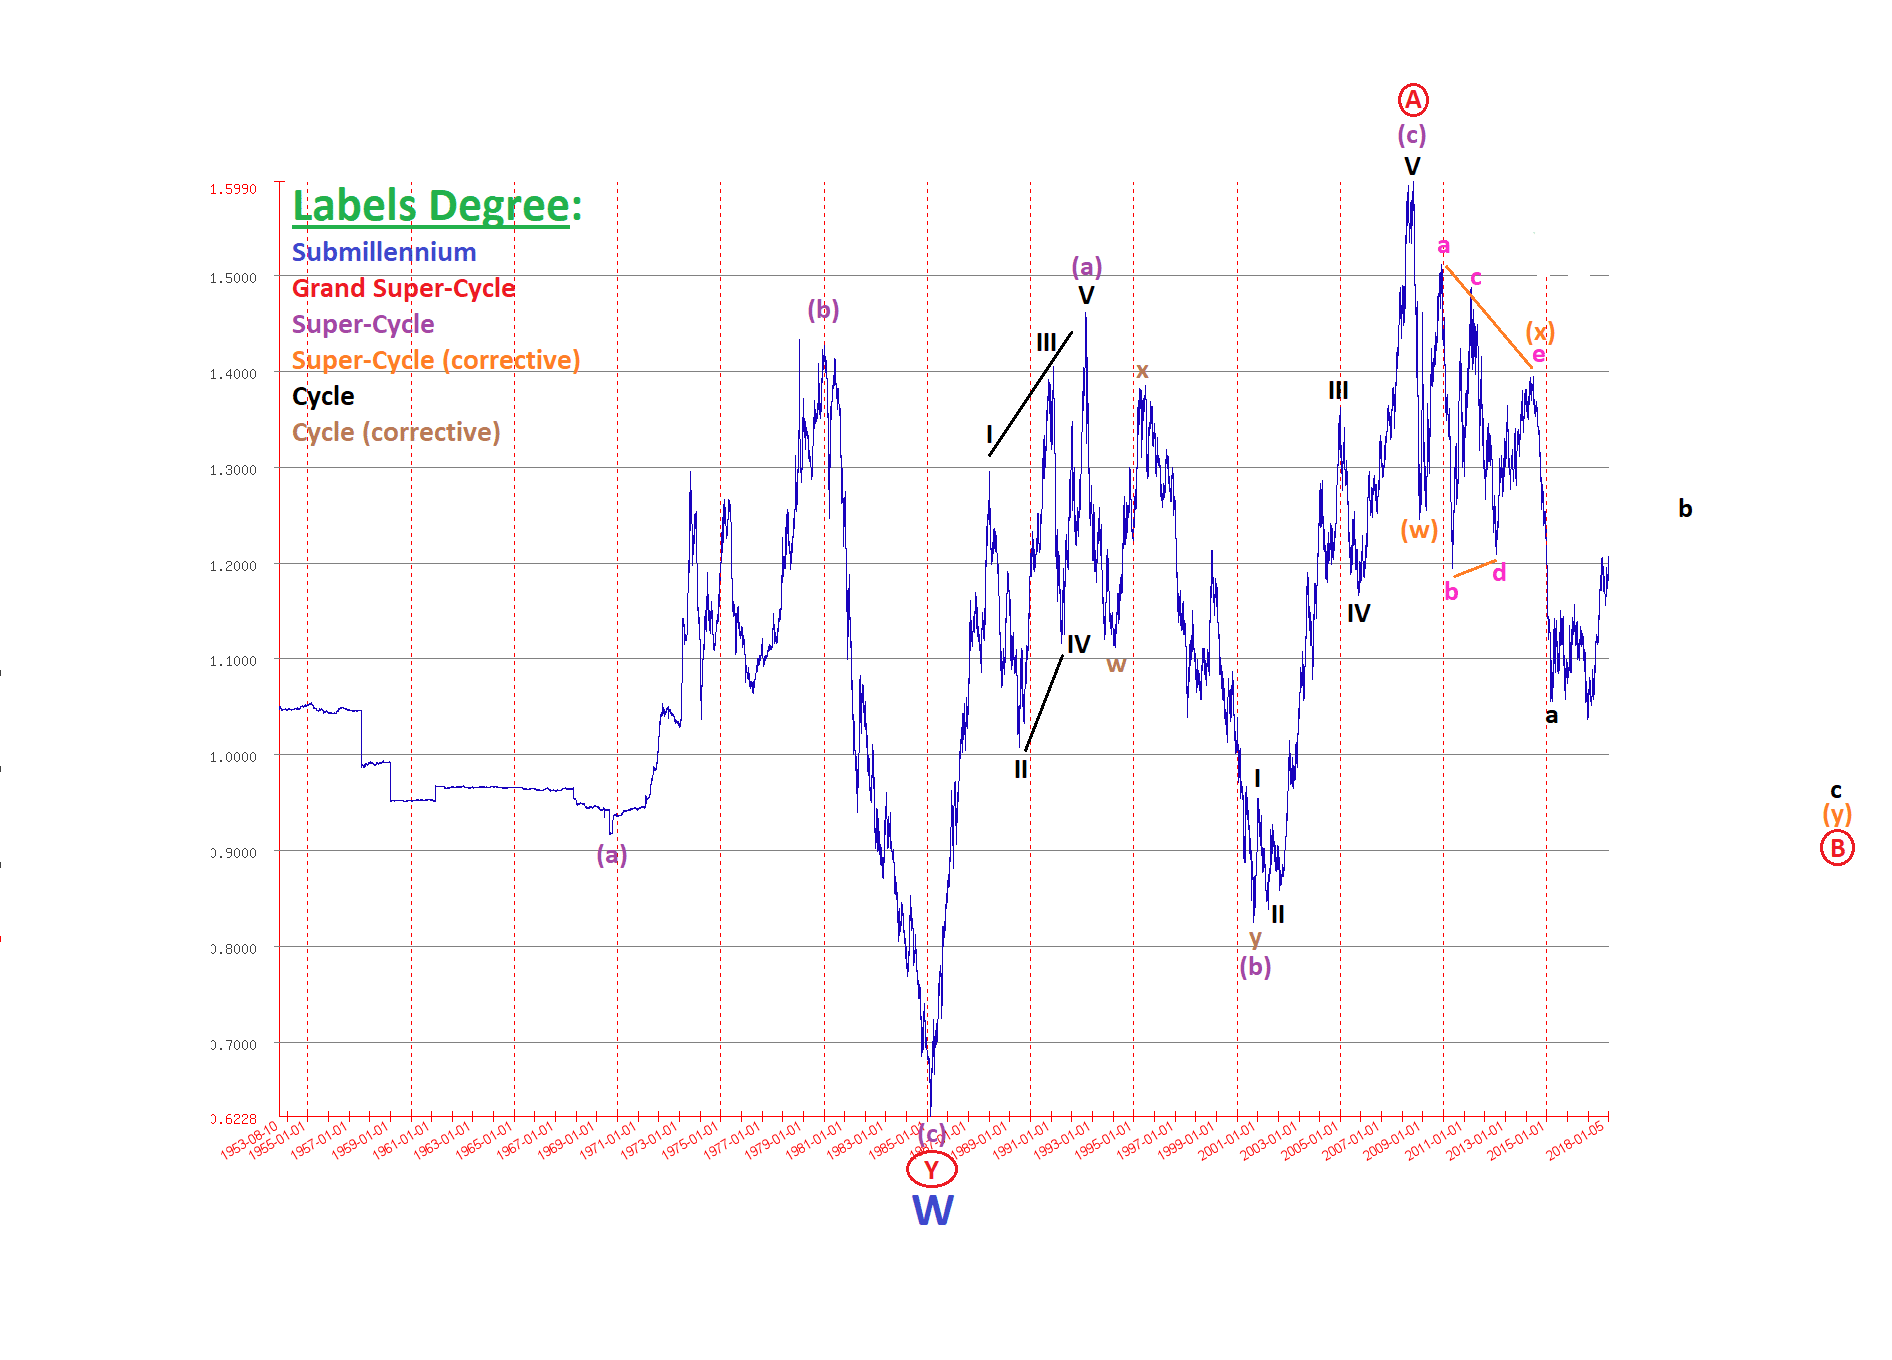
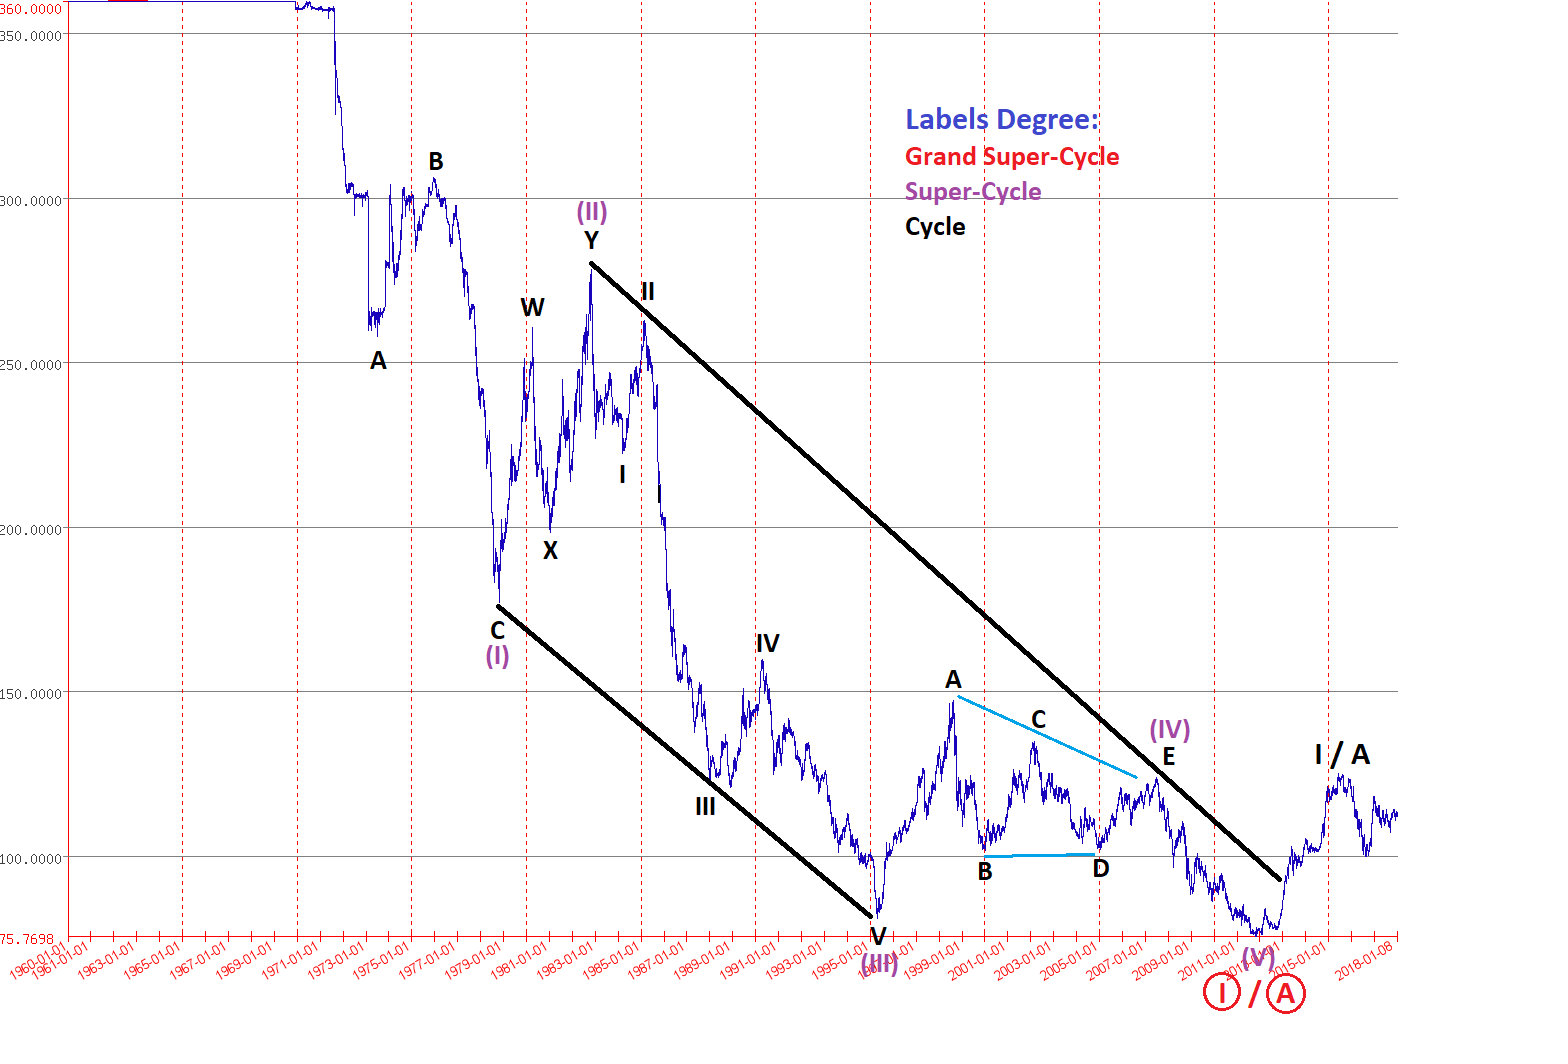
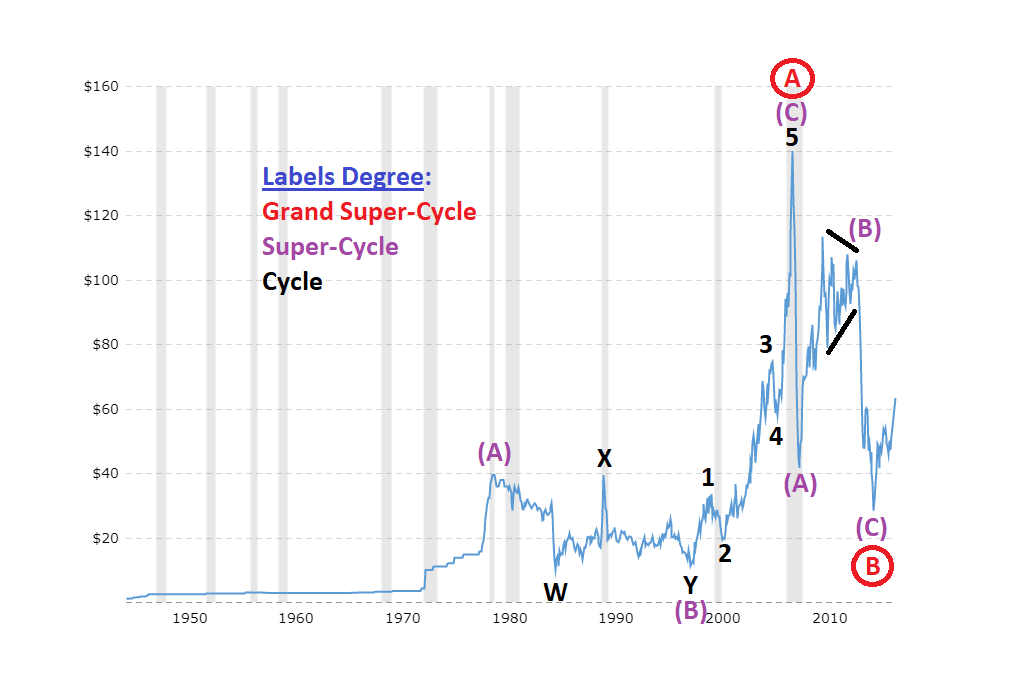
As a Macro Perspective, this fact coincides with the following Elliott Wave labels and degrees:
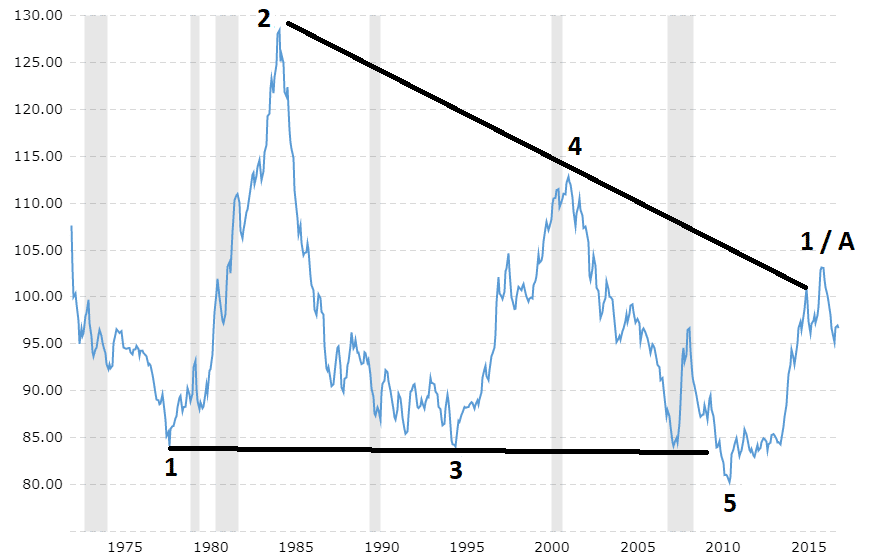
Dollar Index
Dow Jones Industrial Average
SNP500
 GOLD (XAU/USD)
 EUR/USD
USD/JPY

Crude OIL (WTI)
All these Markets are showing possible scenarios where the Market could be facing a Crash.
Technically, in order for all these formulas to align as one, I would want to see some of the following:
- DXY to start a Correction and then a significant drop in order to complete the Bearish Cycle
- EUR/USD to start unfolding as a Corrective Bearish Pattern and then another last Bullish Impulse
- XAU/USD to correct on the down-side and then reaching a possible 1450-1600
- DJIA & SPX correcting on the down-side and then another last Rally
P.S. DOW & SNP500 are possibly starting a bearish journey towards 22.000 and 2500, respectively.
Macro perspective to be continued with Charts and Video explanations.
Analysis & Charts such as the ones posted in the “IBEX35 – Madrid Stock Exchange Crash – Long-Term SELL” article to be posted on Major Global Indices as well.
#market-crash
1 Comment
admin
(February 6, 2018)VIX broke out and volatility is back in play, which means that Fear is kicking in already.
VIX current value is 37.32 which was not seen in a long time. Not a good sign!
“P.S. DOW & SNP500 are possibly starting a bearish journey towards 22.000 and 2500, respectively.”
US Indices already started crashing down, Global Indices following, to be watched closely.