When ready to level up…
[btnsx id=”17550″]
Hello fellow traders and welcome to the Elliott Wave Course Module brought to you by Lionheart Elliott Wave Analysis!
My name is Richard, and I will be your host for this session.
This Module will come with a nice set-up that you could use for your own trading education or to perfect your current strategy. Besides the Elliott Wave Principle, it will also include Fibonacci Mathematical Measurements, Consolidation Areas, Points of Interest (Vibration Levels), Divergences (differences in the Price Action), Types of Structure, and more.
Before we get started with the Elliot Wave Course and talk about how this Principle can be applied to Forex & CFDs trading, you should know that the following material has been published for educational purpose only and does not imply an immediate investment advice.
Should you attempt to use any of the information provided, please do acknowledge the risks involved. Thank you!
Let’s go over some important details together so that we can get a better understanding in regards to this trading concept!
The Elliott Wave principle is a complex way of analyzing the Financial Markets. It reveals how trader’s sentiment works, how people behave and the mass psychology behind buying and selling the assets.
Some believe that this is in fact one of the main laws of the universe and that it can be applied to other aspects of our lives. Well, we’re not going to stretch it that far but instead we are going to discuss how this exercise in probability can help an Elliottician to identify the Market’s Structures and to anticipate the most likely next moves, within the price action on the charts of course.
We are talking here about a catalog with structured patterns on the way the crowd goes from extreme points of pessimism to extreme point of optimism. It is a description of the steps human beings go through when they are part of the investment crowd. Yes, you guessed it! Price Action reflects human beings buy/sell emotions which appear on the charts as patterns. The Elliott Wave Technique is a road-map which traders use in order to classify patterns and be able to set a higher probability for their up-coming trades. The Market has a pulse and a natural way of developing the price action and with this technique, Elliotticians are often one step ahead of the crowd.
In my personal opinion, this is by far the most reliable Leading Analysis tool that a trader could have in his/her arsenal and could be an asset to you, the Ace in the sleeve, if applied correctly. This technique is known to be very subjective among traders though. There are different types of approaches to this and traders tend to start using it and then give up because not everyone succeeds in understanding the concept. Every trader is different in his/her trading style and has his/her own set-ups, so it will be up to you to adapt this concept to your trading strategy.
The challenge that most Elliotticians face lies within the Structure Types, reading, mapping & labeling, hence the reason for the subjectivity and also the reason why Wave Traders tend to have a Main Count and an Alternate Count as well, acting as a back-up.
If new to the Elliott Wave Strategy: It’s recommended to start with the basics and to keep it simple in the beginning, in order to avoid any potential headaches and then, as your knowledge and learning hunger increase, you may choose to see how far the rabbit hole goes and explore/apply the more advanced techniques.
Within this Module we will discuss the structures of the Elliott Wave Concept, the types of waves, cycles, but most importantly how to start counting the right way and how to apply the techniques on your charts.
This module will be split at one point into two categories, a Basic and then an Advanced approach.
Within this Course, we will be talking about many important aspects.
Here’s what’s inside the box:
Sit back and enjoy the ride, it will be worth your while!
BASIC ELLIOTT WAVE MODULE
We spoke a bit until now about the Wave Principle and what it can do.
Let’s take a step back into time and see why this trading technique intrigued so many people.
We are not going to go in depth with his entire history, instead we are going to focus on the main aspects.
Ralph Nelson Elliott was American accountant who in the early 30’s studied 75 years’ worth of stock market data, mostly indexes (from yearly and all the way down to 30 min charts). He discovered that the Stock Market did not move randomly and chaotically as it was believed then, and that it actually followed natural laws which could be measured and predicted by using the Fibonacci sequence (golden ratio). Basically he noticed that prices unfolded in specific patterns.
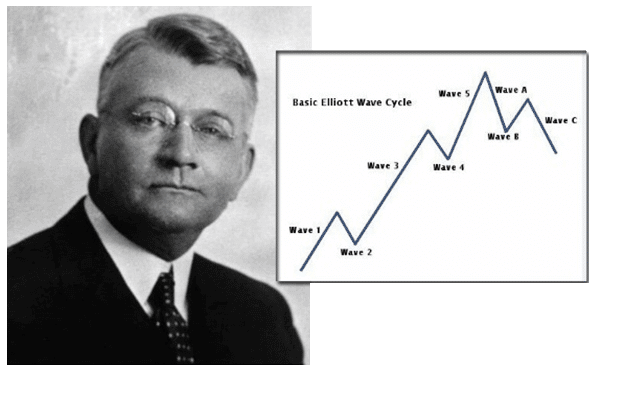
He developed this amazing analytical tool in the 1930’s and then later on, in 1938, he published his theory of market behavior in the book entitled ‘’The Wave Principle’’.
Elliott was a genius. He got his inspiration by understanding the Dow Theory and got to a point where he could measure and predict significant Stock Market emotions and huge moves. He understood the mechanics of trends and counter-trends and saw that Charles Dow (the founder of modern technical analysis) was indeed right. Elliott implemented his own thoughts and created a masterpiece, resulting in his unbelievable and accurate predictions for the later to come Stock Market Crash.
His theory intrigued many, especially after the book with the same name, “The Wave Principle” was published in 1978, when Robert Prechter and A.J. Frost rescued Elliott’s discovery from obscurity.
So, you see, even after more than 80 years, this amazing theory and pattern is still being used these days by hundreds of thousands of traders and investors worldwide.
When setting goals, it is a must to ask these 3 questions. So far we covered the ‘’what’’ in the Elliott Wave explanation. The ‘’why’’ is pretty simple: Wave Traders use this technique in order to trade better or successfully and to generate a certain profit consistency. But “how”? That my fellow traders is the million dollar question. The answer lies within the course, let’s move on.
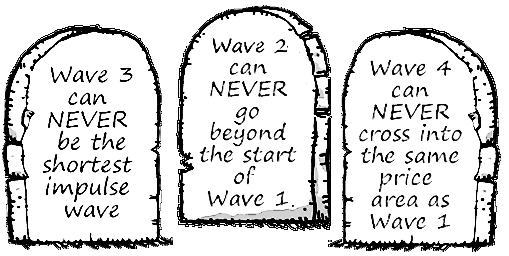
There are 3 Main Rules that R.N. Elliott put his accent on which are the following:
Impulse Wave 3 can never be the shortest wave
Wave 2 can never retrace beyond the start of Wave 1
Wave 4 can never cross into the same price area as Wave 1
These rules, just like all rules in general, are bent sometimes, so don’t be afraid to think outside the box and question everything.
What I would suggest is that when one of these 3 rules are broken, then a review needs to be done for the wave count.
With that being said, next we’re going to go over some important bullet-points to be treated as guidelines when using Wave Analysis.
When ready to level up…
[btnsx id=”17550″]
There are 2 choices that one can make when applying the Elliot Wave theory on his/her charts and when counting the waves, Simple and Advanced. The Simple technique implies counting the waves normally (without any solid understanding but focusing only on key reversals) and the Advanced implies going more technical and recognizing the Impulsive or Corrective structure type.
We will start with the Simple Approach and then move towards the Advanced one and expand our trading senses.
Please note that the figures to come will be explained in detail in the relevant chapters.
For now, we’re just taking a look at what this could will be able to teach.
Impulsive or Motive Waves come in 3 forms: Extensions, Ending and Leading Diagonals.
Ending Diagonal – Wave C
Ending Diagonal (Contracting) – Wave 5
Ending Diagonal (Expanding) – Wave 5
Leading Diagonal – Wave A
Leading Diagonal – Wave 1
Corrective Waves come in 5 forms: Zig-Zag, Flat, Triangle, Double & Triple Three.
Zig-Zag Correction
Flat Correction
Double & Triple Three – Complex Structure
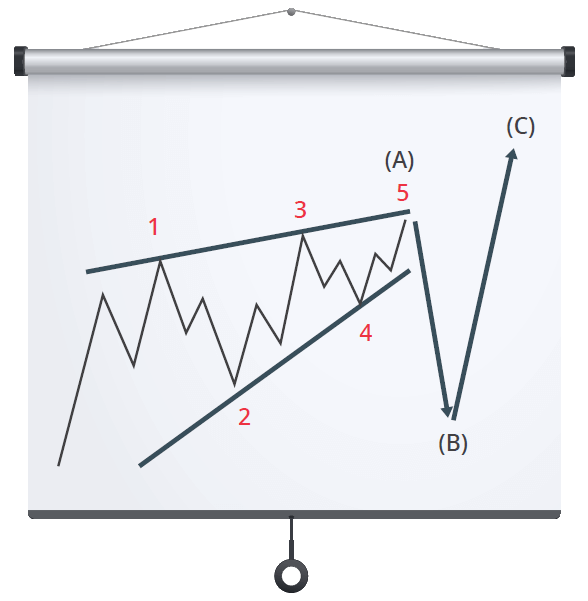
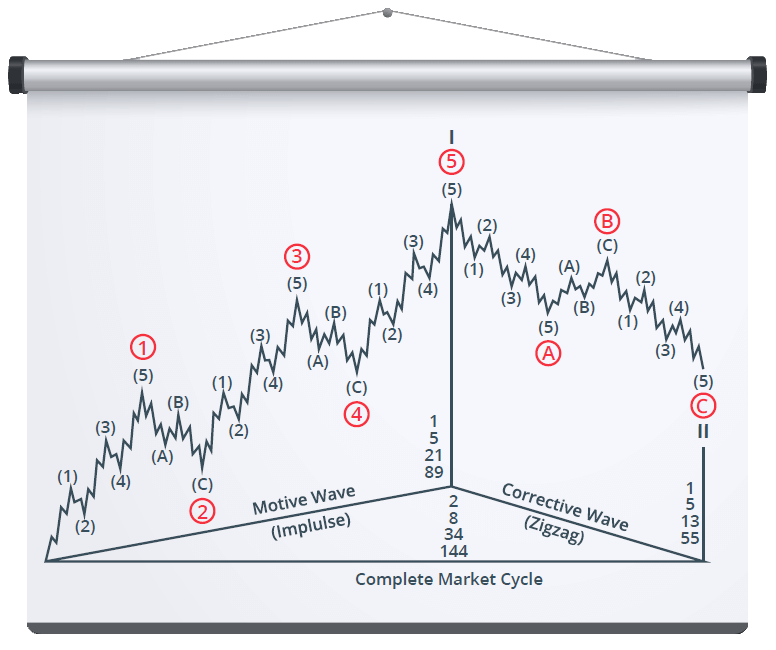
The Market has a law of its own and the progression unfolds in ‘’Waves’’, as R.N. Elliott called each Price Action Swing.
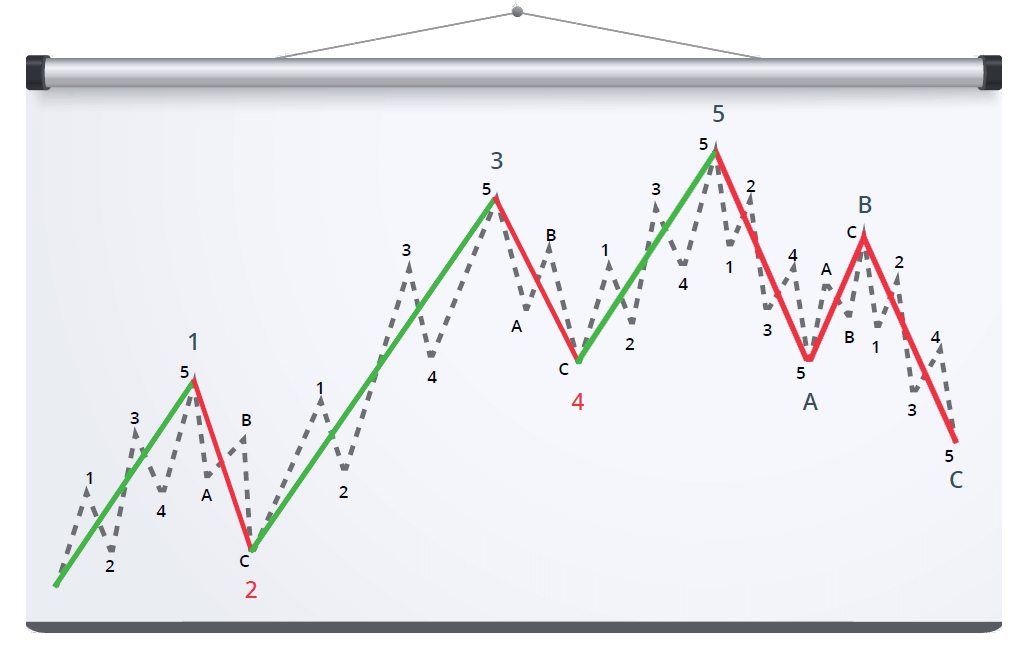
In a Dominant Trend, progress ultimately takes the form of 5 Waves, which are labeled with numbers, 12345. Three of these swings, which are 1, 3 and 5, actually affect the overall direction, in favor of the Dominant Trend. These Swings are known as Motive Waves, also called Impulses.
Within the 5 Wave Sequence, the 3 Waves that unfold in favor of the Dominant Trend are separated by two counter-trend interruptions, which are labeled as 2 and 4. These Swings represent a temporary interruption of the Impulse Waves, hence the reason why they are called Corrective Waves.
Simply put, the Wave Principle states that a Full Cycle is formed out of 8 Swings and that the Market moves with 5 Waves in the direction of the Main Trend and then with 3 Waves against it.
Once the Impulsive Phase is complete, then the Trend Corrective Legs unfold and act as a pull-back, labeled with letters A, B & C.
Time for some facts and bullet-points!
Price Action moves in patterns and usually has the magic numbers set to 3 and 5.
A Bullish or Bearish Elliott Cycle is formed out of 3 Impulsive Waves (#1, 3 & 5), two Corrective Waves (#2 & 4, these waves correct the impulsive 1 & 3) and then followed by the Trend Correction legs – A, B & C.
So, if you don’t want to complicate things, you can apply the basic usage of the theory, 12345-ABC, simple right? BUT! It’s not that simple, if only it would be.
If you aspire for an accuracy higher than 60-70%, then I would definitely recommend the Advanced technique.
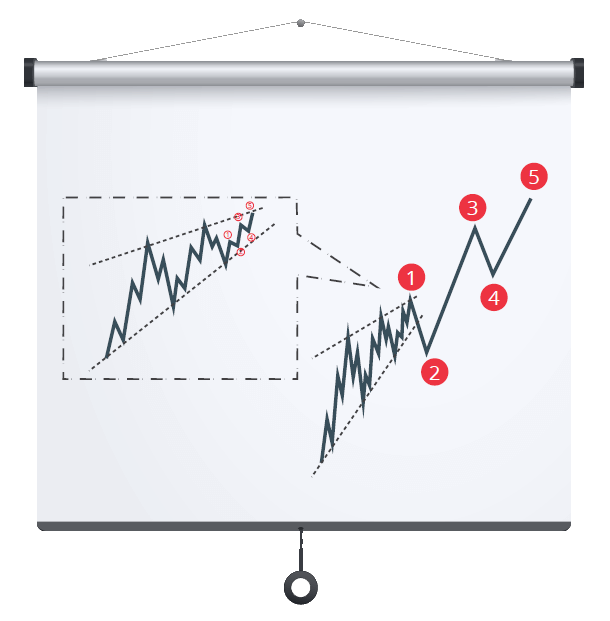
Impulsive or Corrective Waves are usually formed out of other Elliott Waves, as they are Fractal by nature.What I mean by this is the fact that you will find an Elliot Wave within a larger Elliot Wave due to the fact that each Wave contains sub-waves.
Impulse Wave #3 is usually the strongest swing but sometimes #5 can be just as strong. This is because traders take profit on the 3rd Impulsive Wave and then after the 4th Retracement Wave, they get in again on the 5th Impulsive Wave. Or simply put, traders got used to the Elliott method and this is why the 5th Wave tends to have a bigger impact on the charts lately, especially in the commodities market.
Most of the times Impulse 3 contains an extension, which would imply Impulse 5 to have the same length as Impulse 1.
Corrective Waves 2 & 4 can have 2 forms, Simple (3 moves) and Complex (5 moves) and if Wave 2 is Simple, then Wave 4 will be Complex, and vice versa, due to the Law of Alternation. Usually, corrective wave 2 unfolds with a Zig-Zag Structure.
Sometimes, on rare occasions, the C Corrective Wave can transcend into Impulse Wave 1.
Wave C always unfolds with a 5 Wave Sequence.
Wave B and Wave X always unfold with a 3 Wave Sequence and are known to be the cause of Market uncertainty, fake break-outs or even Structure change.
ABC Correctives can provide a strong gain, depending on the size of the Impulsive Waves.This is because at the end of the 5th Wave, Divergences occur giving Traders the possibility to spot the difference in the price action.For example in an up-trend a new high would be created while the volumes would decrease, meaning that Bulls pushed the Market higher but they are not justifying a continuation with enough liquidity, leaving room for Bears to take over.
When the Market goes into a Correction, the correction itself would often end its first swings inside the price territory of the previous Wave 4 of a lesser degree. This is valid exclusively for a Wave 4 which would end in the territory of the previous Wave 4, within the main Impulse 3.
Now, let’s move a bit towards the wave numbering and the default measurements.
When ready to level up…
[btnsx id=”17550″]
ADVANCED ELLIOTT WAVE MODULE
Wave 1 is an Impulsive Wave for another Cycle and it’s rarely obvious because the previous trend is still considered dominant and strong.At this stage volumes are rising but not enough to alert technical traders and make them aware of a new cycle beginning.This wave often looks ‘’choppy’’ and is difficult to distinguish, taking forms of Leading Diagonals or Wedges, also having occasional overlaps.It is usually accompanied by Divergences & Candlesticks Formations and as all Motive Waves, it contains a 5 swings sequence.
Wave 2 is a Correction of Wave 1 and it usually does not retrace more than 61.8% on the fibs. If it does, then under no circumstance can it retrace beyond the start of Wave 1 as that would invalidate the wave count and one of the main rules.Even though Wave 1 began a new Cycle, the previous trend is still considered powerful and the starting point of wave 1, which is the low or high of the previous trend, would be retested aggressively.Wave 2 always unfolds with a 3 swings sequence and usually takes the form of a Zig-Zag ABC.Corrective Wave 2 rarely forms Complex Structures and a Wave Trader should not look for Triangle Formations within this Corrective Wave. Volumes should also be lower than the ones in Wave 1 signaling weakness.
Wave 3 is next and it’s usually the largest Impulsive Wave, which can offer a 100% or even 161.8% target.Fibonacci Extension tool is specifically used in order to determine the TP target, at the projected end of Wave 3, by measuring Wave 1 with its retracement Wave 2.This is the most traded Wave and it is well known for its clean look and solid candles. At this stage the Fundamentals and News are positive, causing Price Action to move rapidly, with shallow and short-lived corrections.Elliotticians are usually looking to trade the 3 of 3’s, which is the 3rd Sub-Wave within the 3rd Main Wave.
Wave 4 by nature is typically corrective and is well known for its Complex Structures or its extended sideways movements.It usually retraces 38.2% of Wave 3 and its volumes reflect a much lower reading than Wave 3. Sometimes the Pullback extends towards the 50% Fibonacci Retracements of Wave 3, depending of course if the Retracement in Wave 2 was indeed limited, in which case the Law of Alternation would kick in.A very important fact to keep in mind is that Wave 4 does not enter the price territory of Wave 1. If this happens, then the Wave Count should be reviewed. Acceptable cases, in some trader’s views, would be the ones when the candlestick shows an insignificant wick or shadow, which tends to happen recently, with modern technicals and high volatility, making them to accept it and bend the rule a little. Another exception would take place in Diagonals or Wedges.At this stage the trend is clearly established and Wave 4 represents the profit-taking at the end of Wave 3. Psychologically speaking, this is the point of indecision where the trend is countered by the weaker side, in an attempt to gain somewhat control, however, what really happens is the fact that the dominant side is only taking a breather before getting back in.Wave 4 is often seen as frustrating in some trader’s eyes because of its way of developing, with complex structures. This makes the labeling very difficult sometimes and an unprepared trader can get caught up in a ‘’whirlpool’’, thinking that the trend will reverse when in fact it doesn’t. A good Elliottician knows that Wave 4 represents a Continuation Pattern, regardless on how the Structure develops making it a ‘’challenge’’.
Wave 5 is the final leg in the direction of the dominant trend. Volumes are lower than in Wave 3 which indicates that the dominant trend is showing Price Action continuation but with lack of power, much lower than in Wave 3. At this stage Momentum Indicators or Oscillators are showing Divergences which are the signs to look for when it comes to Wave 5’s end. In other words, the trend is still continuing but the dominant side is not injecting enough liquidity in the Market in order for the movements to be sustained, making room for the other sides to spot this fact and to gain control.It is known that the 5th Wave has become larger these days in Commodity Markets, showing extensions and sustained continuation signs, therefore, caution is a must because a Divergence can extend as well in those markets.
Wave A represents the start of the ABC Trend Reversal legs and the effect of the Divergence. It is typically harder to identify and its moves are most of the times unclear, due to the fact that Fundamentals are still somewhat in favor of the previous Dominant Trend. This Wave starts and determines the Corrective Structure, therefore, it can unfold with 3 or 5 Swings Sequence. Usually it reaches the Vibration Levels of Wave 4 and the most it can run is towards the beginning of Wave 5.
Wave B is correcting Wave A, usually with a 50% Retracement and with lower volumes than in Wave A. However Price Action can move rapidly within this Wave, showing a stronger retracement, even exceeding the start of Wave A, causing confusion, with Fake Break-outs and buyers-sellers indecision during volatile times.This wave always unfolds with a 3 Swings Sequence and under no circumstance it should be labeled with 5 Impulsive Swings, ever.Most common way of combining this ‘’tricky’’ wave with the Classical Technical Analysis is by mapping it as the second shoulder in a Head and Shoulders Formation.Caution! Wave B is the cause of Complex Structures and difficult labeling.
Wave C is known to have consistent volumes on its side, clearing up the Market’s doubts on the actual trend, showing power in its swings.This Wave always unfolds with a 5 Swings Sequence, regardless of the structure type. It’s well known for the Impulsive look and it is also the most traded wave from the entire ABC Corrective Structure. Usually it has the same length as Wave A, showing a 100% reading on the Fibonacci Extensions from Waves A&B, but quite often it can extend towards 161.8% levels and even beyond.To be noted that Waves A & C tend to develop in the same amount of time and length, especially in Zig-Zag Structures.
When ready to level up…
[btnsx id=”17550″]
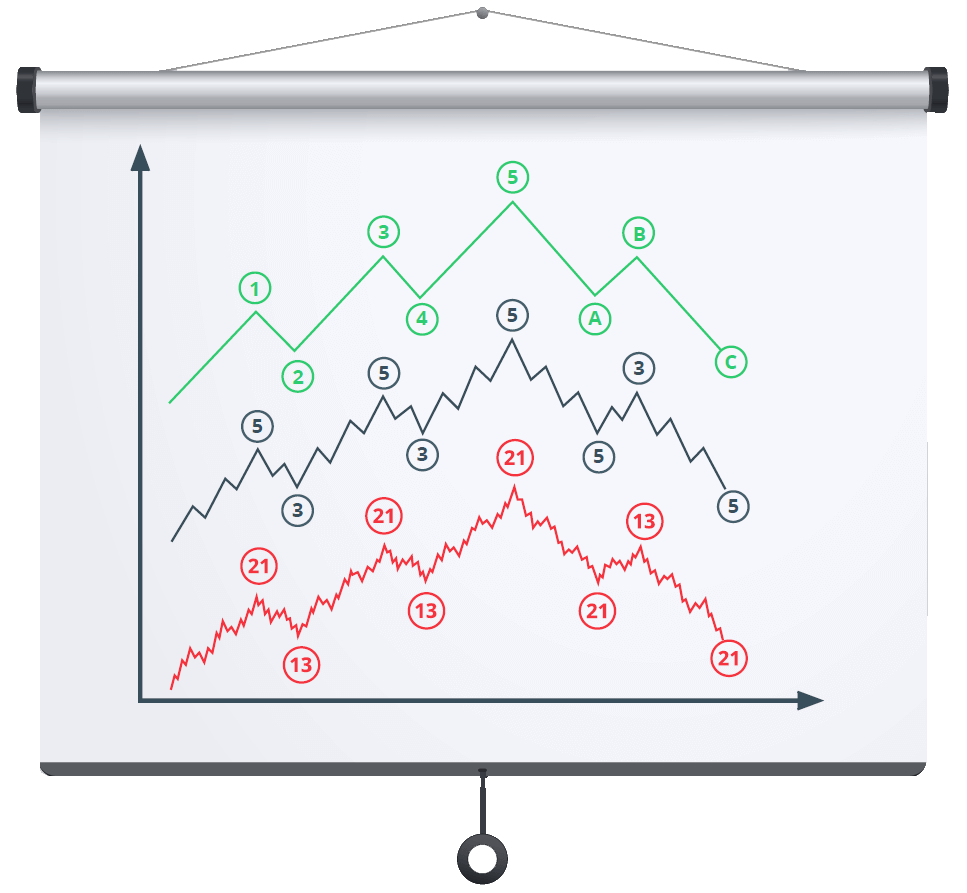
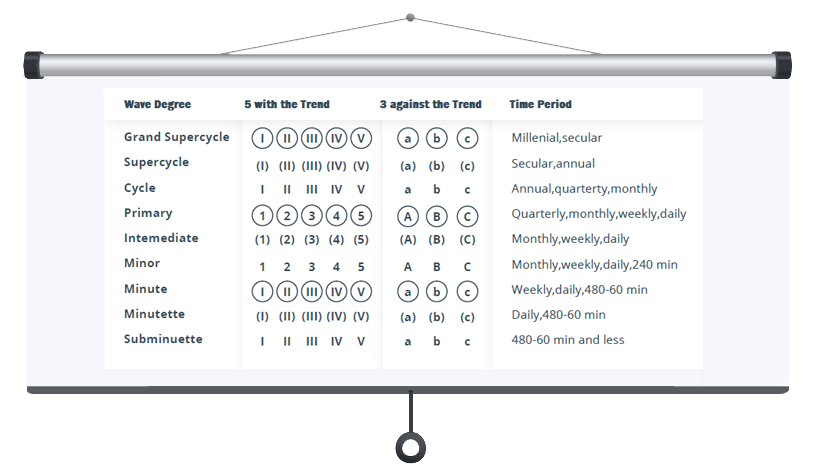
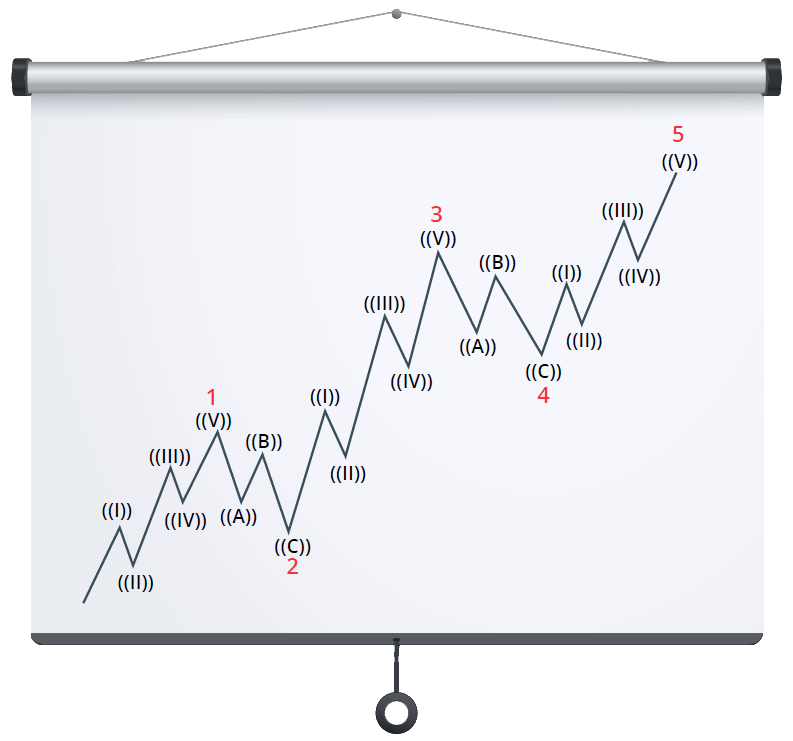
Price Action Swings are Fractal by nature and using Elliott Wave relies heavily on charting and technical analysis. The structures unfold as self-similar patterns appearing at every degree of trend. Naturally growing fractals expand and grow more complex over time. This means that no matter how big or small the wave degree, impulse waves take on a 5-wave sequence and corrective waves take on a 3-wave sequence, with impulse waves sub-dividing into 5 smaller waves and corrective waves sub-dividing into 3 smaller waves. This means that the application of the Wave Principle is a form of pattern recognition and these natural patterns occur in the collective human psychology via buying and selling decisions, which reflect in market prices.
A wave’s degree is determined by its size and position but also by its form. That is why Elliott decided to classify each specific swing with numbers and letters. By using the labels shown in the picture, an analyst is capable of identifying precisely the position of a wave in the overall progression of the Market. Due to the Fractal Pattern, Cycle waves subdivide into Primary waves that subdivide into Intermediate waves that in turn subdivide into Minor waves, and so forth.
The Fibonacci Sequence is the basis of The Wave Principle, this is what Elliott concluded.
Fractal Pattern works hand in hand with the Fibonacci Sequence and in a Full Cycle of 8 Waves, which are 1-2-3-4-5-A-B-C, we can find 89 Waves in the Impulsive Patterns and 55 Waves in the Corrective Patterns.
Leonardo Fibonacci is the inventor of the Fibonacci Summation. This series takes 0 and adds 1 as the first two numbers. Succeeding numbers in the series adds the previous two numbers and thus we have 0, 1, 1, 2, 3, 5, 8, 13, 21, 34, 55, 89 to infinity.
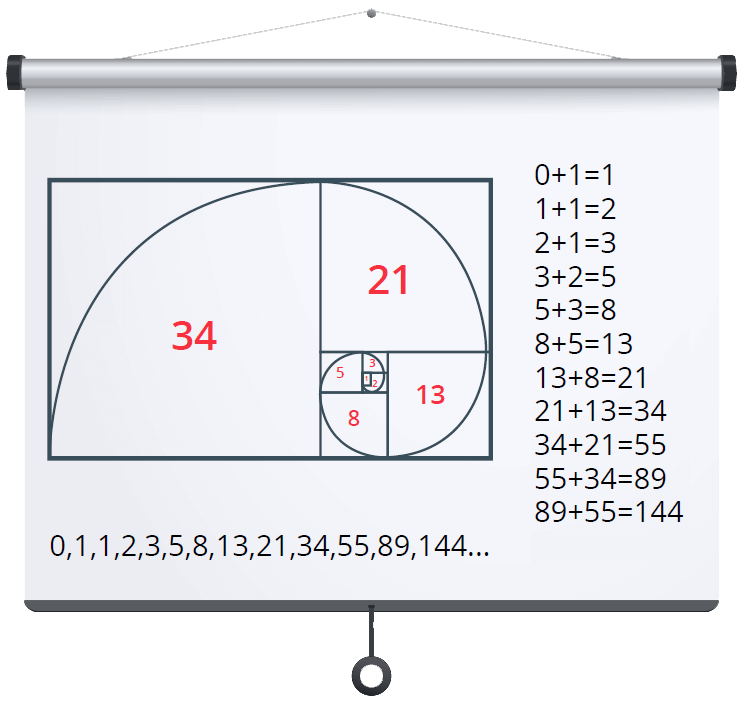
The Golden Ratio (.618 / 1.618 / 2.618, etc) is a must when applying The Wave Principle as it often reflects Fibonacci Targets, Projections or Measurements, end of waves, Consolidation Areas and Points of Interest.
Golden Ratio is obtainable by dividing a Fibonacci number with a previous Fibonacci number.
Examples: 89 / 144 = .618 or 144 / 89 = 1.618 or 144 / 55 = 2.618
In Structures, waves relate to one another with the Fibonacci Ratio, hence the reason why measuring an impulse with its correction would determine the Fibonacci projections for the next moves and waves. Fibonacci Retracement and Fibonacci Extension tools are specifically used for this purpose.
The Fibonacci Sequence can be found in Waves as they unfold and somehow the Market and Traders’ psychology seems to be programmed by mathematics, hence the reason why some Automated Trading Systems (EA’s) are programmed as well to follow the Fibonacci Sequence.
These are all Fibonacci numbers.
I know, it took me some time to believe it as well …
When ready to level up…
[btnsx id=”17550″]
Motive Waves always move in the same direction of the Dominant Trend and their goal is to make progress. They are easy to recognize because of their sustained and violent moves. Within a Motive Swing, Wave 2 never retraces more than 100% of Wave 1, Wave 4 never retraces more than 100% of Wave 3 and Wave 3 will always surpass Wave 1.
As Elliott stated, Wave 3 mustn’t be the shortest Motive Wave, therefore, as long as it travels with a higher percentage than either Wave 1 or 5, the rule is fulfilled.
There are 3 types of Motive Waves which are destined to make progress in a trend: Impulses, Ending & Leading Diagonals.
IMPULSE
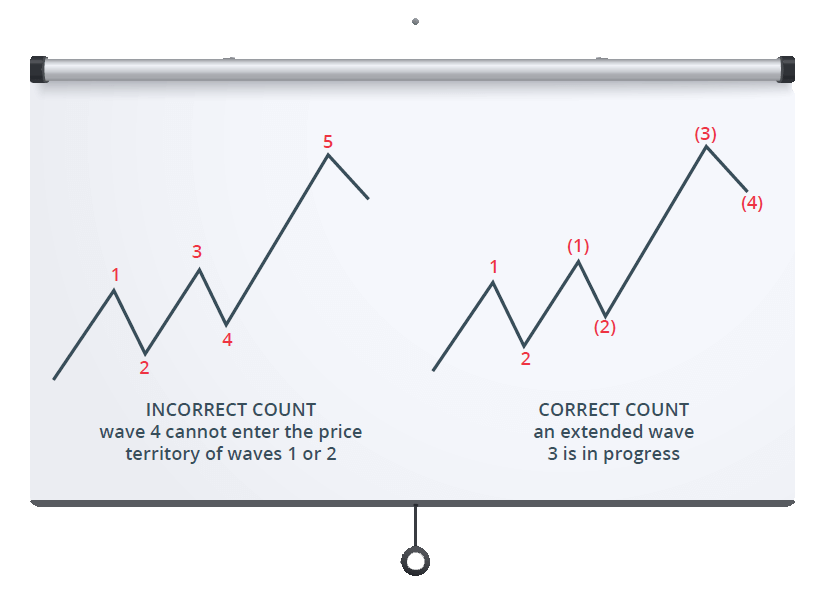
An Impulse is the most common Motive Wave in which Wave 4 never overlaps with Wave 1 or enters its territory.
In an Impulse one of the motive sub-waves (1, 3 or 5) would almost always present an extension and the Sequence is always 5-3-5-3-5, without any exceptions.
The rules mentioned earlier governs all Motive Waves and should never be disregarded in order to achieve a greater practical utility, resulting in correct counting or labeling.
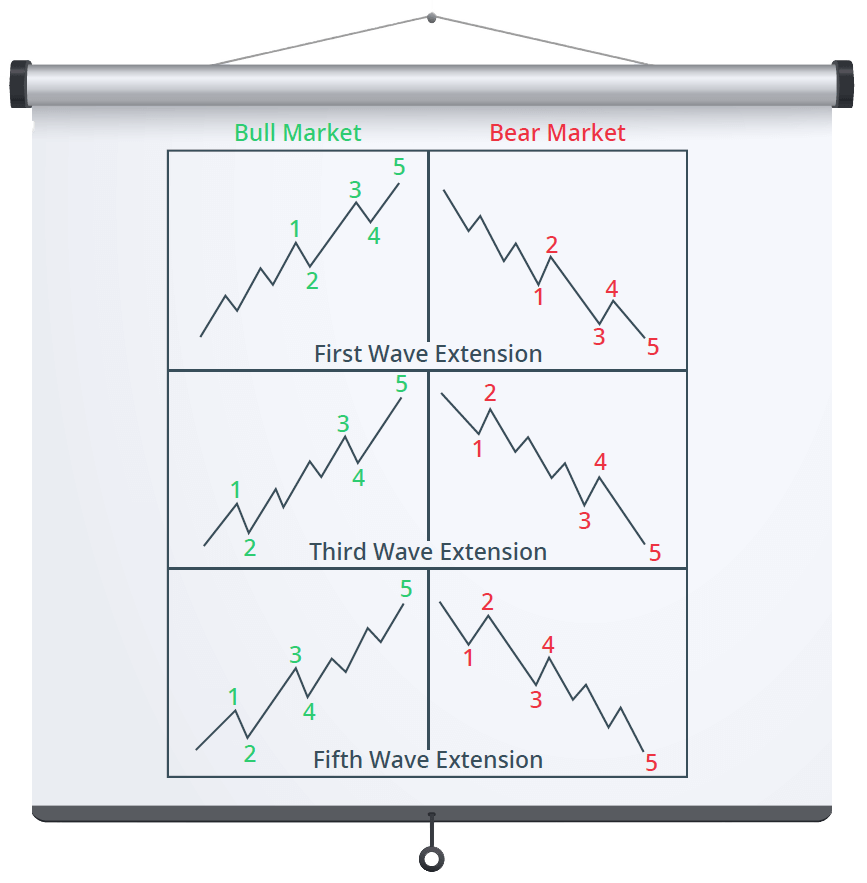
Extensions represent those sustained rallies with exaggerated sub-divisions, in which one of the Motive Sub-Waves themselves present a prolonged move.
Only one Extension per each Impulse is accepted and this provides a very useful guide on expected lengths of upcoming waves. For example: if Wave 3 has the same length as Wave 1 then we would most probably expect an extension in wave 5, or, if wave 3 extends, then wave 5 should resemble wave 1 as duration and length.
Extensions also occur within extensions, making this the sub-wave extension of the larger degree extension. Traders these days often look for the 3 of 3’s.
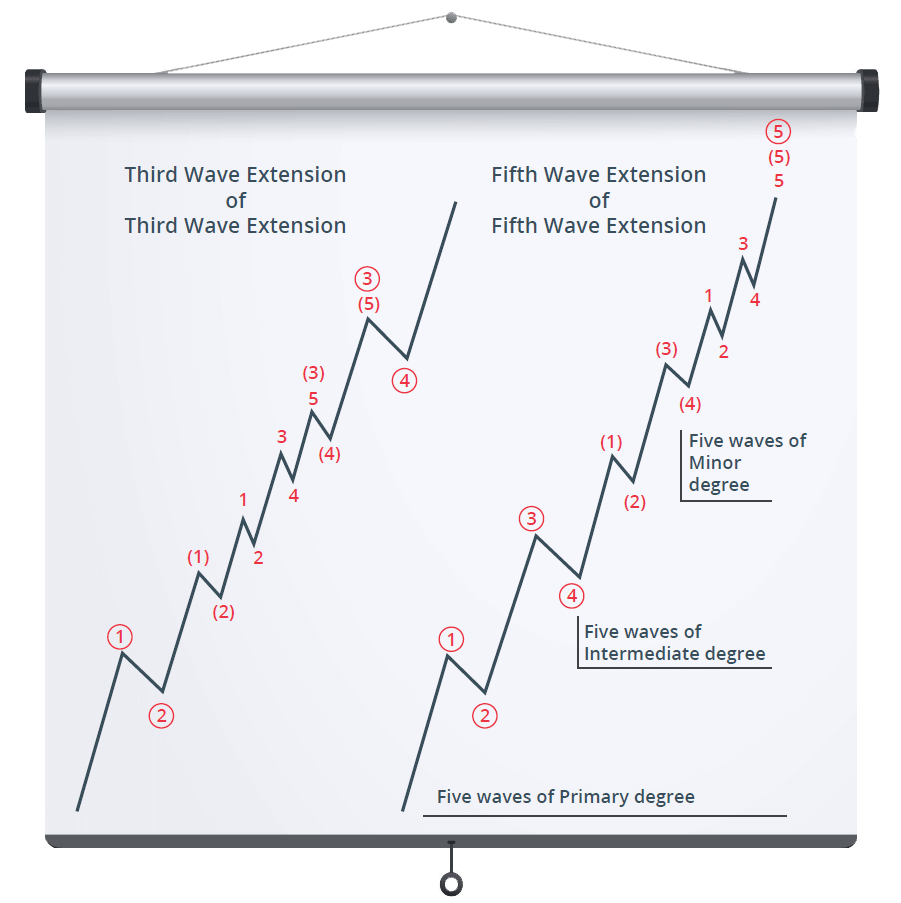
Wave 3 is typically and most commonly the extended wave, hence the reason why Wave Traders tend to form the habit of labeling the extension in its early stages of development. A good way to spot an extension would be when Wave 3 is proven to be unacceptable, shorter than Wave 1 or when the retracement enters Wave 1’s territory, in which case it would need to be relabeled as the 1st sub-wave in the extension itself.
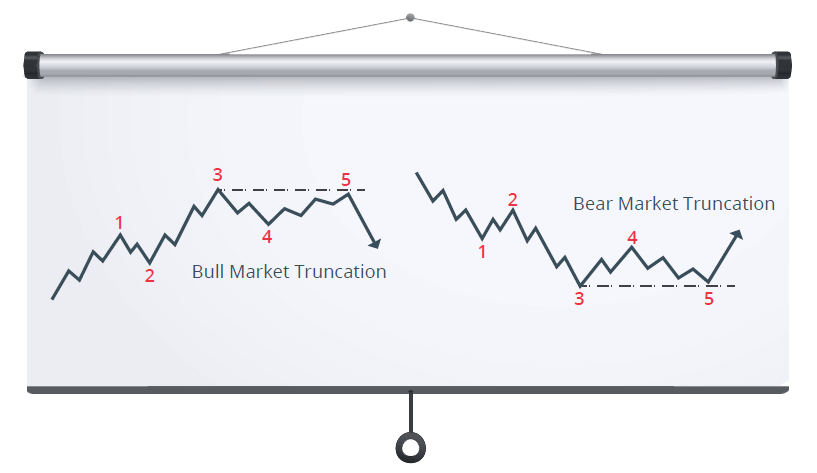
Following an exaggerated extension, a phenomenon called ‘’truncation’’ may occur in and only in the last 5th Wave, when it does not move beyond the end of Wave 3. R.N. Elliott referred to it as ‘’failure’’ but in modern technical analysis traders call it ‘’truncation” or “truncated fifth”. This phenomenon rarely happens and it represents the countering side’s power, after the exaggerated extension is showing exhaustion signs, accompanied by a sustained Divergence.
Such truncation cannot be accurately seen in advance and can only be validated by the presumption that Wave 5 contains the Impulse Structure.
DIAGONAL
The Diagonal does not present an extension, therefore it is not an Impulse. However, it is a Motive Wave but a special one. This structure presents the characteristics of an Impulse, where corrective legs do not retrace more than 100% of the previous moves in favor of the main trend, but the other two rules are broken: Wave 3 could reflect as the shortest swing (rarely) and Wave 4 always overlaps with Wave 1. It’s a hybrid, with motive and corrective features.
Diagonals take either 3-3-3-3-3 or 5-3-5-3-5 forms in their Structures, depending on their location, and are usually signs of drastic changes in trends. They take a Wedge Shape within two converging lines and are used by traders as reversals confirmations.
Ending Diagonal – Wave C
Ending Diagonal (Contracting) – Wave 5
Ending Diagonal (Expanding) – Wave 5
Leading Diagonal – Wave A
Leading Diagonal – Wave 1
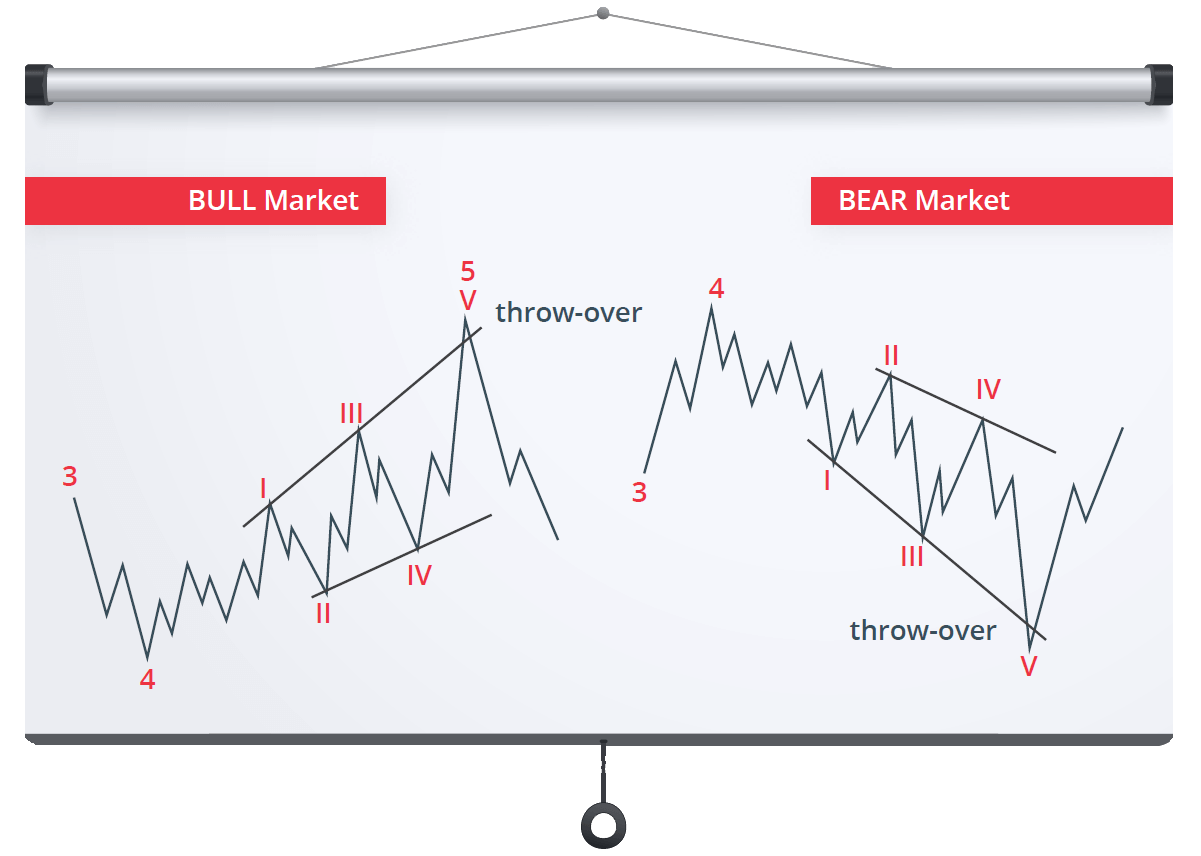
ENDING DIAGONAL
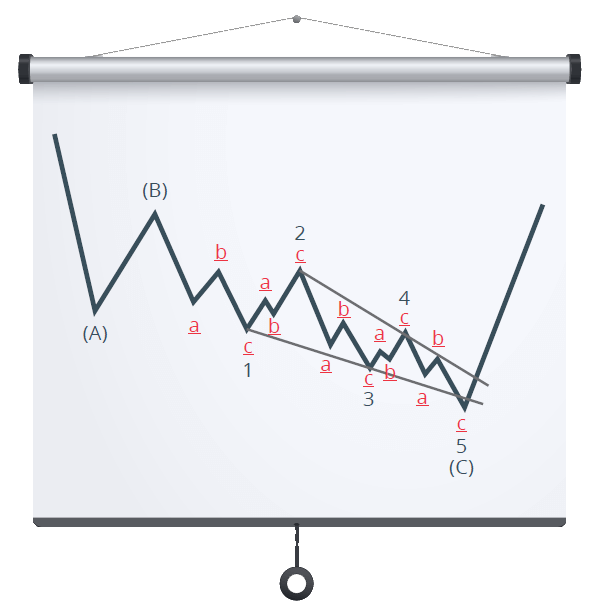
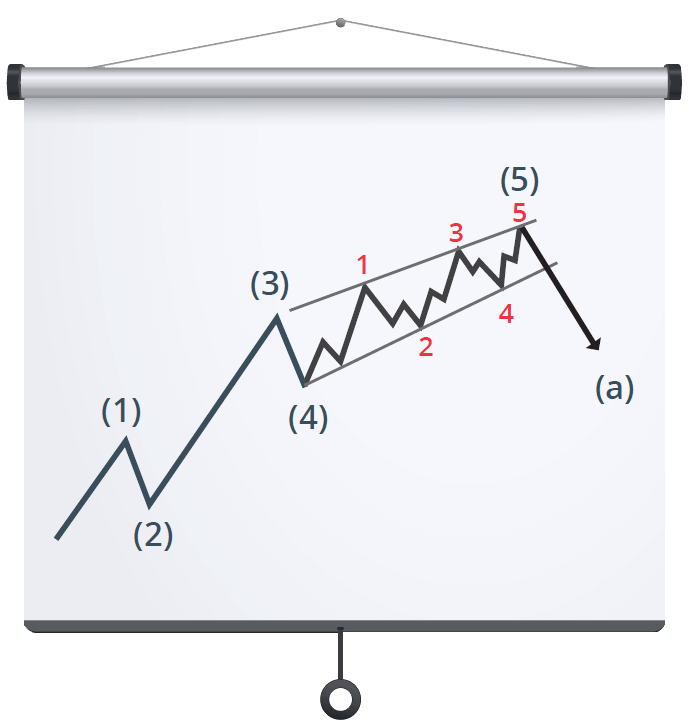
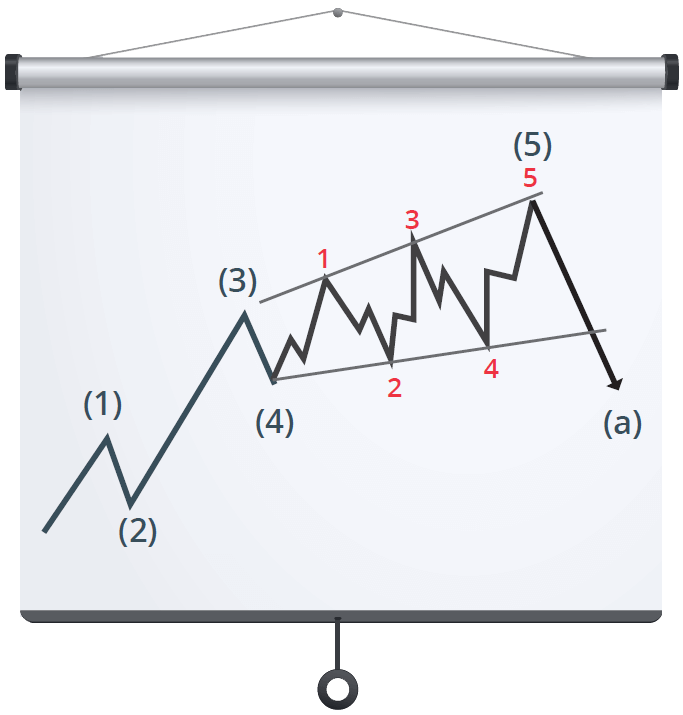
The Ending Diagonal is a pattern that occurs when the preceding move has gone ‘’to far too fast” as Elliott put it. This pattern can be found mostly in the fifth wave position, at the end of an Impulse, and it usually signals dramatic change of price action direction due to present Divergences. It can also be located in an A-B-C Corrective Structure, but only in the final C Wave. An ending Diagonal is indicating exhaustion of the larger movement, hence the reason why it can be found at the termination points of larger patterns. An Ending Diagonal which is rising is a Bearish sign and one which is declining is a Bullish sign.
Characteristics:
3-3-3-3-3 Structure with all 5 swings subdividing into Zig-Zags (a-b-c)
Takes a wedge shape within two converging lines
Wave 4 overlaps with Wave 1 but not exceeding the start of Wave 2
Wave 1 is the longest swing and Wave 3 cannot be shorter than Wave 5
Located in the 5th Wave position of an Impulse or in a C Wave within an A-B-C Correction
Wave 5 usually breaks the converging line before the change
Reversal pattern which is usually accompanied by a noticeable Divergence
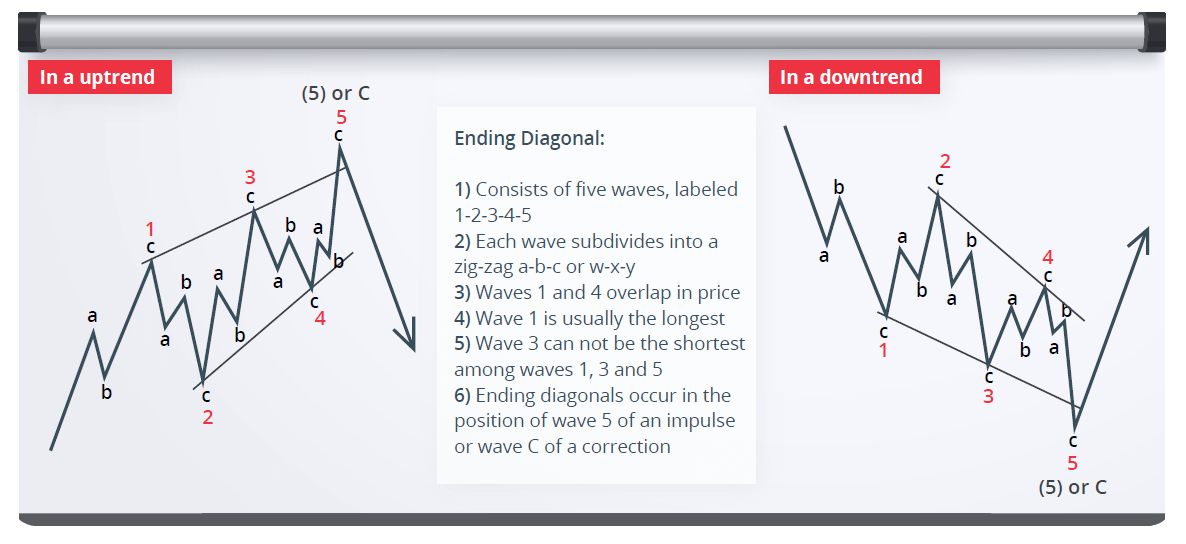
An Ending Diagonal can also take an Expanding shape in which the lines are diverging. All other characteristics apply as an Ending Diagonal except for the facts that Wave 3 could be the shortest swing and Wave 5 is the strongest.
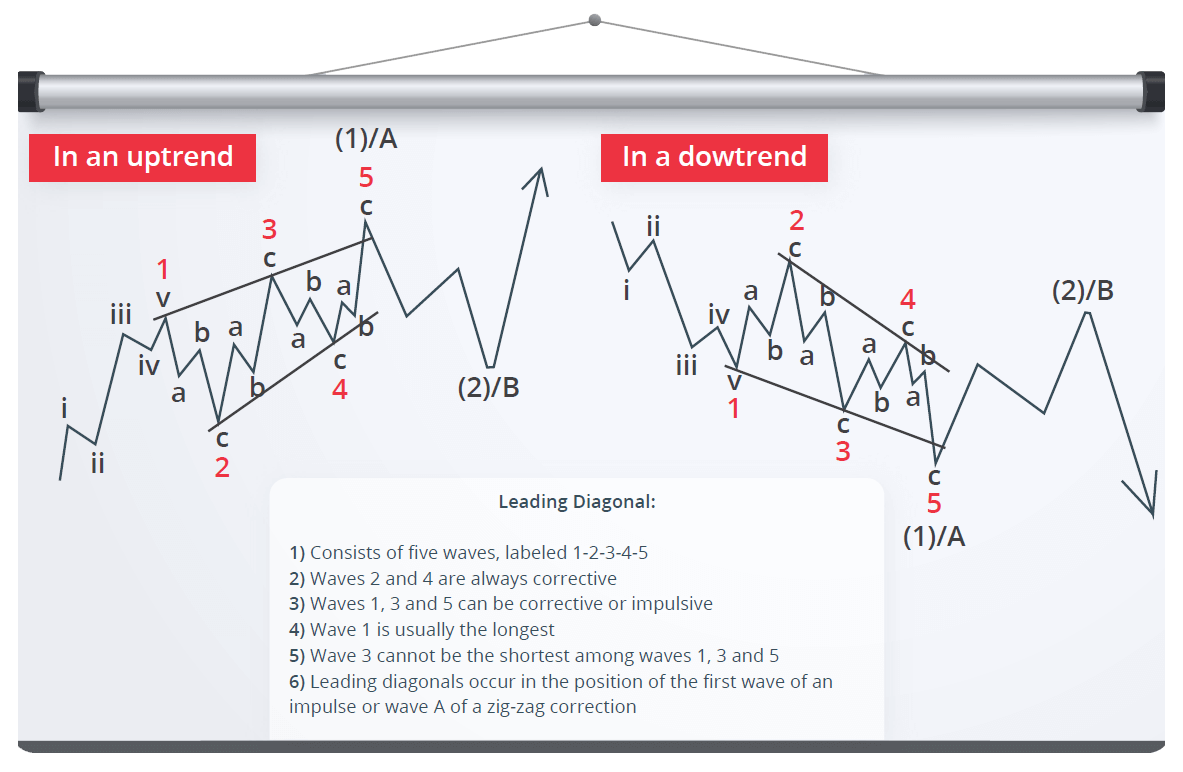
LEADING DIAGONAL
The Leading Diagonal is also a pull-back pattern with continuation characteristics, which presents 5 overlapping and contracting Impulses, within a wedge shape converging lines. A Leading Diagonal is usually a sign of a deep retracement and it can be found in a Wave 1 position or in a Wave A within an A-B-C correction. Unlike the Ending Diagonal, besides the 3-3-3-3-3 Structure it can also take a 5-3-5-3-5 form, in which only Wave 2 and 4 subdivide as Zig-Zags (a-b-c).
Characteristics:
3-3-3-3-3 or 5-3-5-3-5 Structure with Waves 2 and 4 subdividing into a Zig-Zags (a-b-c)
Takes a wedge shape within two converging lines
Wave 1 is the longest swing and Wave 3 cannot be shorter than Wave 5
Wave 4 overlaps with Wave 1 and presents a retracement much smaller than Wave 2
Continuation pattern which is usually followed by a deep pull-back
Located in the 1st Wave position of an Impulse or in an A Wave within an A-B-C Correction
When ready to level up…
[btnsx id=”17550″]
The Market’s Price Action moves against the Main Trend in an attempt to prevent it from developing only Impulse Waves. It’s a natural process that needs to occur in order for a continuation to take place. This process is called Correction and resistance from the Dominant Trend prevents it from developing Motive Structures, hence the reason why Corrections are not making progress which would impact the destined direction. Corrections represent the struggle and conflict between the two opposite sides and trending degrees of a larger scale.
The conflict between the two sides is the reason why Correctives are less clearly identifiable than Motive Waves and also the reason why they are much more varied in their structures.
Corrections increase and decrease in their complexity as they unfold and this is precisely why Elliotticians sometimes find it difficult to fit them into recognizable patterns. This is because the termination points of Corrective Waves are less predictable than Motive Waves. Even so, a trader’s main goal is to gain on Impulses. That is why when using the Elliott Wave technique, mapping, reading and labeling correctly a Corrective Structure is an undeniable requirement for successful trading, so that the next Impulse could be anticipated. The Analyst practicing the Elliott Wave method is aware that, when the Market is in its corrective stages, more caution is implied along with patience. This is due to the fact that there are multiple possibilities in which a Correction can unfold its Structure.
There’s good news as well.
Just like Motive Waves, Corrections also imply their own rules and guidelines. The single and most valuable rule is that an entire Corrective Structure is never formed out of five Impulses, only Motive Waves are formed out of five Impulses. That is why Motive Waves are called ‘’fives” and Correctives are called “threes”. As an example, if a 5th Wave from an Impulse ends and it’s followed by a Wave which contains 5 moves within a lower degree, then that wave cannot represent the entire correction, but only the start of it and just one piece from the total of three.
Unlike Motive Waves, Corrective Patterns are labeled with letters in order for the patterns to be distinguished.
Correctives can present themselves either as a Sharp Correction or as a Sideways Correction (Complex). Due to the Law of Alternation it is known that, within one larger degree wave, corrective legs usually balance each other in the sense that if one is Sharp then the next would be a Sideways move. For example, if Corrective Wave 2 is Sharp (Zig-Zag), then Corrective 4 would unfold Sideways (Flat, Triangle, Combination).
Categories:
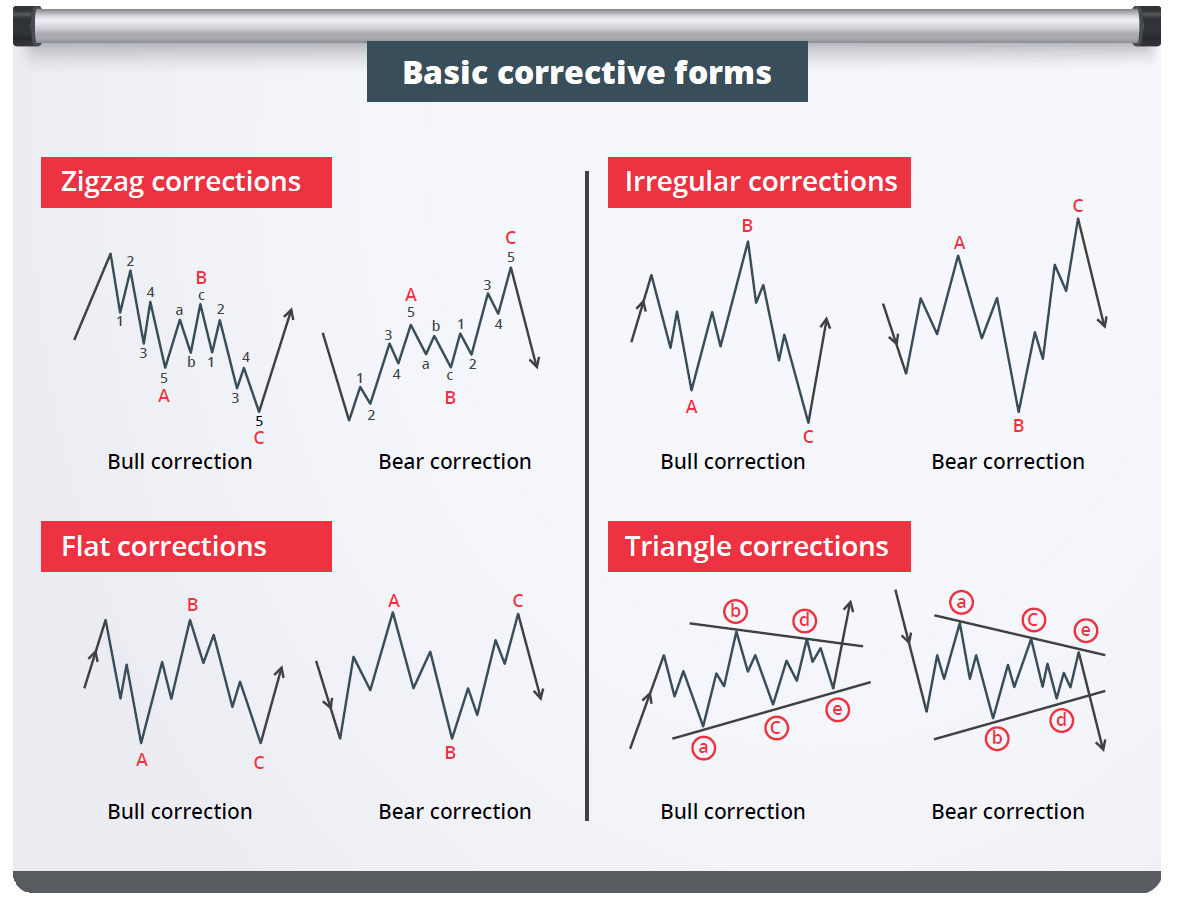
Corrective Structures fit into three Main Patterns: Zig-Zag, Flat & Triangle.
Combinations of the above form Complex Structures and they fit in two Patterns: Double & Triple Threes
Labels:
Zig-Zag / Flat – A , B , C
Triangle – A , B , C , D , E
Double Three – W , X , Y
Triple Three – W , X , Y , X , Z
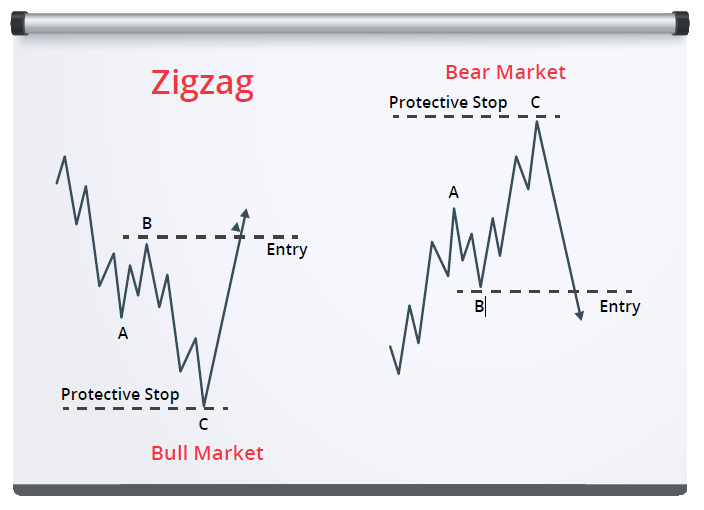
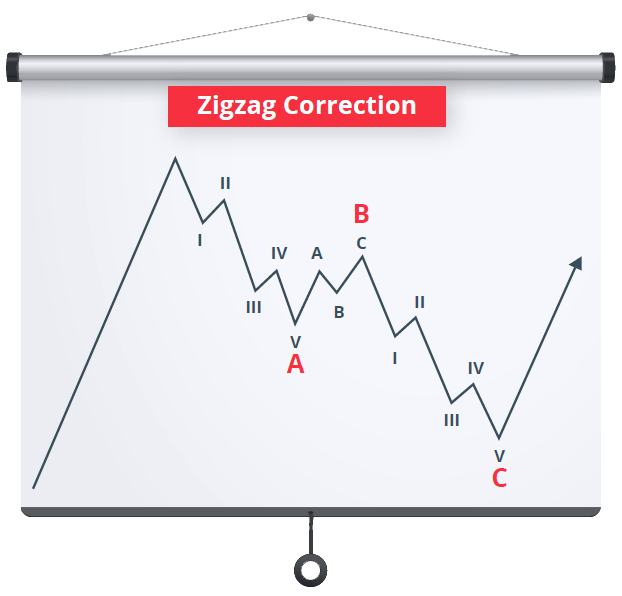
ZIG-ZAG PATTERN
The Zig-Zag is the most common Elliott Wave Structure which always presents a 5-3-5 sequence, with Wave B not presenting a considerable retracement.
Wave C often equals Wave A in its length, hence the reason why it extends beyond the end of Wave A.
It is known that Zig-Zags occur twice or even three times forming combinations. Such combinations are called Double & Triple Zig-Zags.
Characteristics:
5-3-5 Sequence with Wave A and C acting as Impulses
Wave B can only present a corrective pattern (three)
Wave A is an Impulse or an Leading Diagonal
Wave B never travels beyond the start of Wave A and its default measurement is 38.2 or 50% Fibonacci Retracement
Wave C is an Impulse or an Ending Diagonal and it usually measures 100 or 161.8% Fibonacci Extension of Wave A
Appears mostly in Wave 2 but because it’s very common, it can appear in any type of corrective swing due to the fact that it is considered as a “bridge” between combinations.
Tip: Traders often draw a Parallel Channel from the start of Wave A towards the end of Wave B in order to determine the end of Wave C.
When ready to level up…
[btnsx id=”17550″]
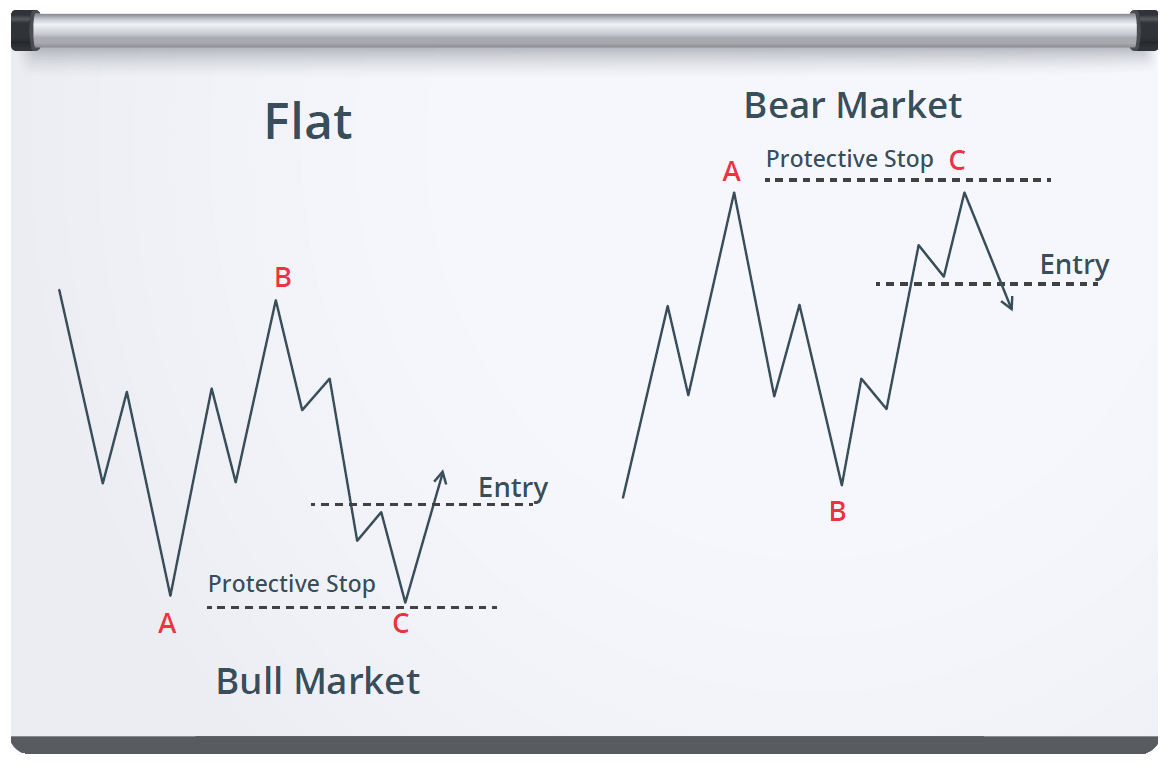
FLAT PATTERN
The Flat is the second most common Pattern and it always shows a 3-3-5 Sequence because it lacks sufficient force, hence the reason why Wave B shows a more powerful retracement, terminating at or slightly beyond the start of Wave A. It is well known for its sideways movements and can also act as the “bridge” for combinations.
Flats tend to appear before or after periods which involve an extension, most commonly in a Wave 4.
They come in three forms: Regular, Expanded (Irregular) & Running.
During this type of correction, the Dominant Trend shows considerable resistance, therefore Flats are well known for their ‘’fake break-outs’’ caused by Wave B, which in turn cause exaggerated or even limited Wave C reactions, depending on its form.
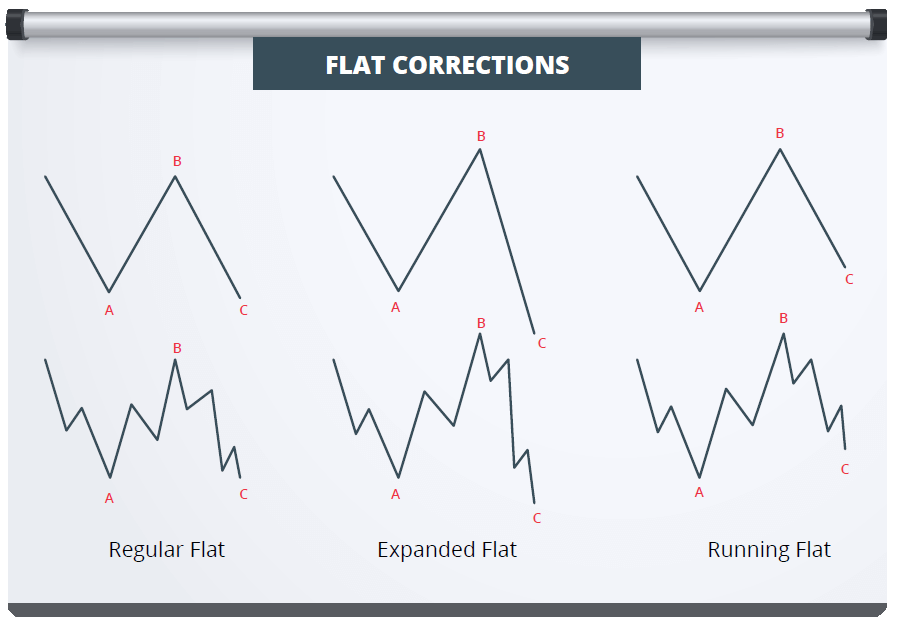
Simple (Regular) Flat
Characteristics:
3-3-5 Sequence with Wave A acting as the “border”
Waves A and B always show three swings
Wave B retraces between 78.6 and 100% of Wave A
Wave C is an Impulse or an Ending Diagonal and it usually finds its end at or slightly beyond the end of Wave A
Appearance alternates between Waves 2 and 4 and very common in Wave B
Wave C usually measures 100% Fibonacci Extensions of Waves A and B
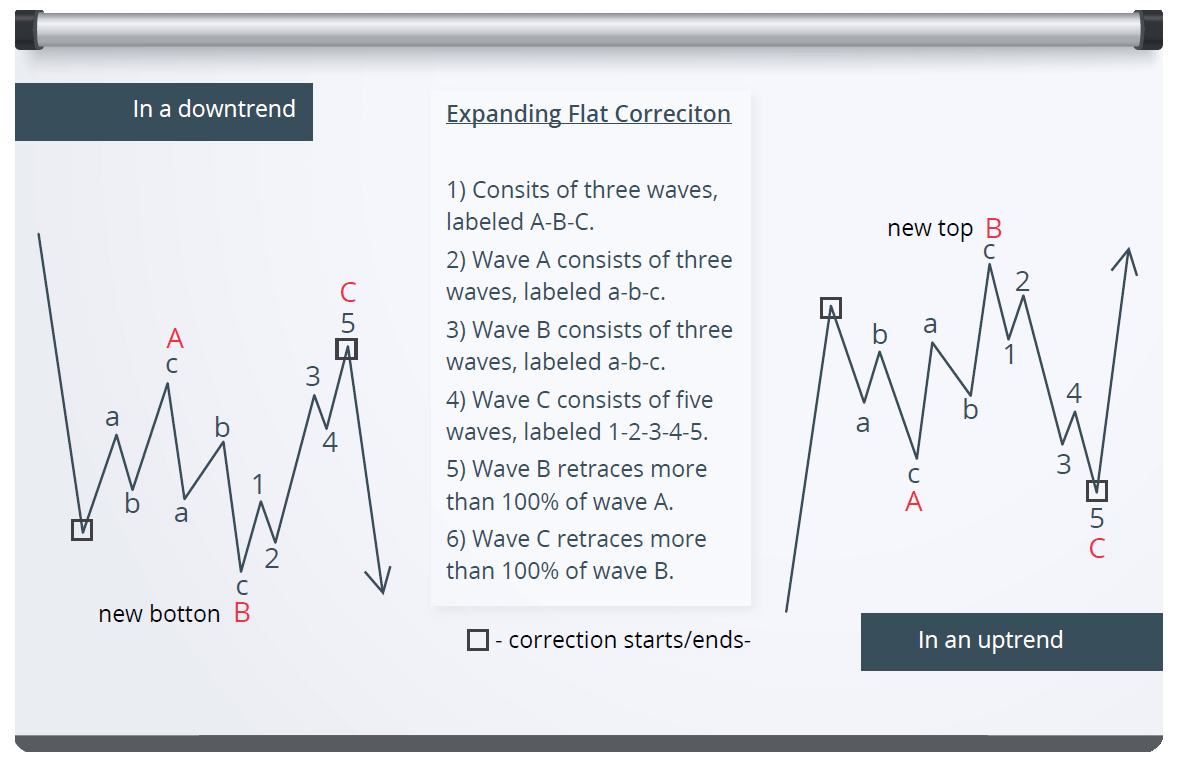
Expanding (Irregular) Flat
Characteristics:
3-3-5 Sequence with Wave B acting as the “fake break-out”
Waves A and B always show three swings
Wave B travels beyond the start of Wave A, usually between 100 and 138.2%
Wave C is an Impulse or an Ending Diagonal and it always finds its end beyond the end of Wave A
Appearance alternates between Waves 2 and 4 and very common in Wave B
Wave C usually measures around 138.2 or 161.8% Fibonacci Extensions of Waves A and B
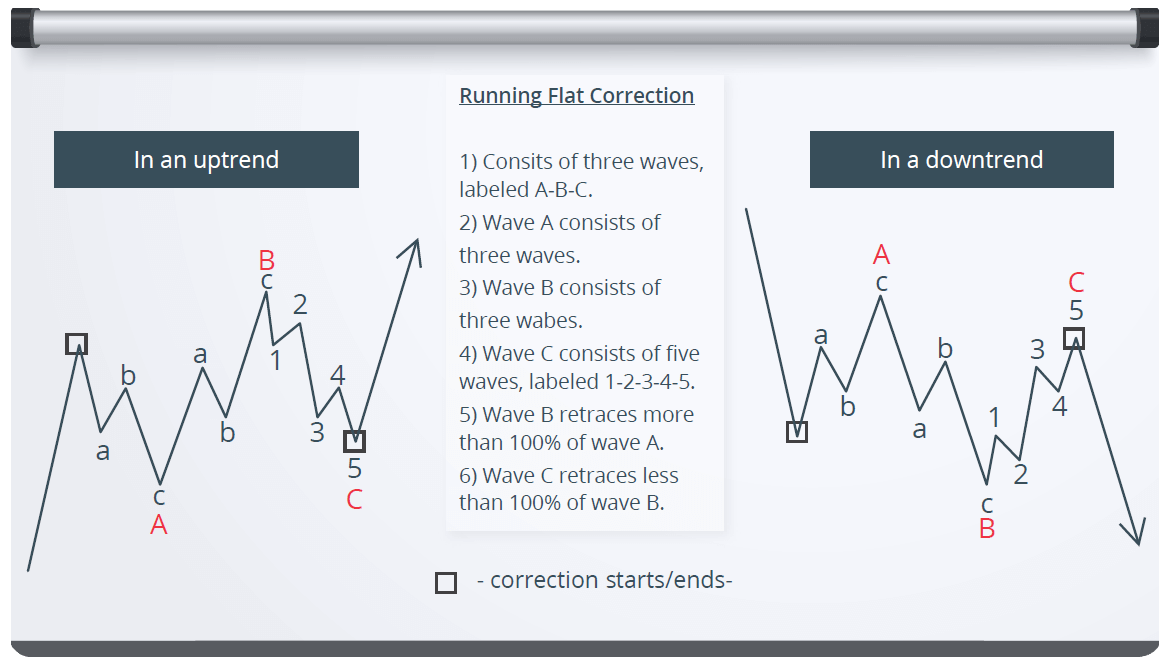
Running Flat
Characteristics:
3-3-5 Sequence with Wave C acting as the “limited impulse”
Waves A and B always show three swings
Wave B travels beyond the start of Wave A, usually between 100 and 138.2%
Wave C is an Impulse or an Ending Diagonal and it does not travel beyond the end of Wave A
Appearance alternates between Waves 2 and 4 and very common in Wave B
Wave C usually measures around 100% Fibonacci Extensions of Waves A and B
Flat Corrections, as mentioned earlier, just like Zig-Zags, they are considered as a “bridge” for Combinations, also called Complex Structures.
Here are some examples before we go further into Combinations:

When ready to level up…
[btnsx id=”17550″]
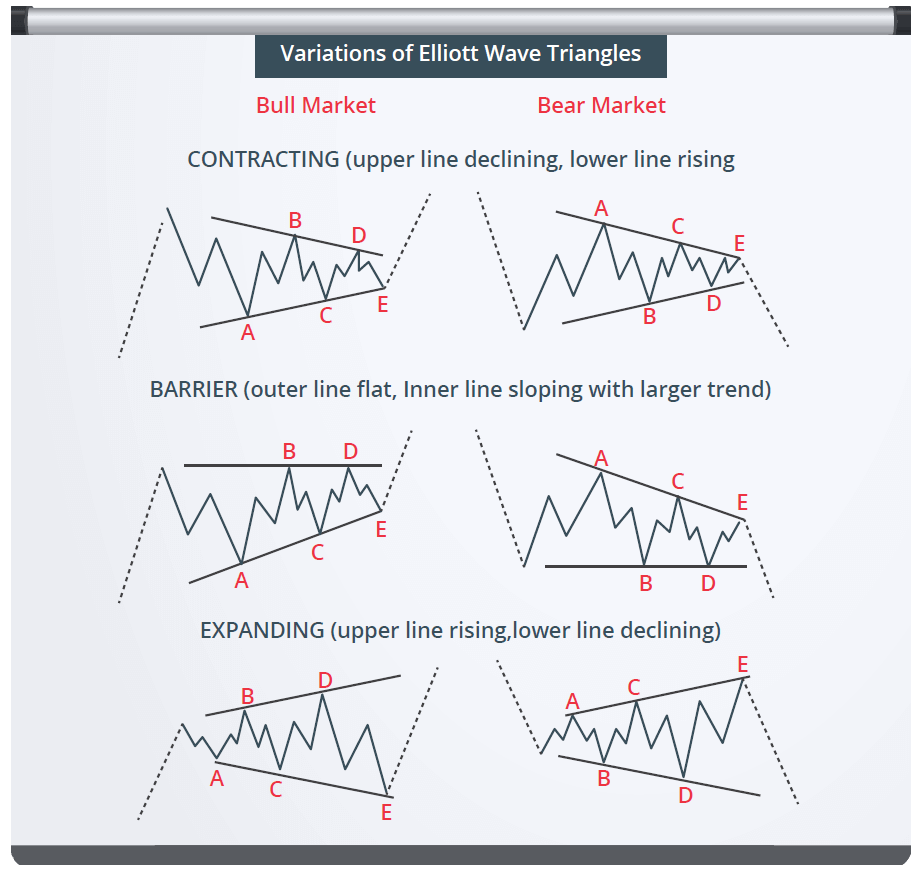
TRIANGLE PATTERN
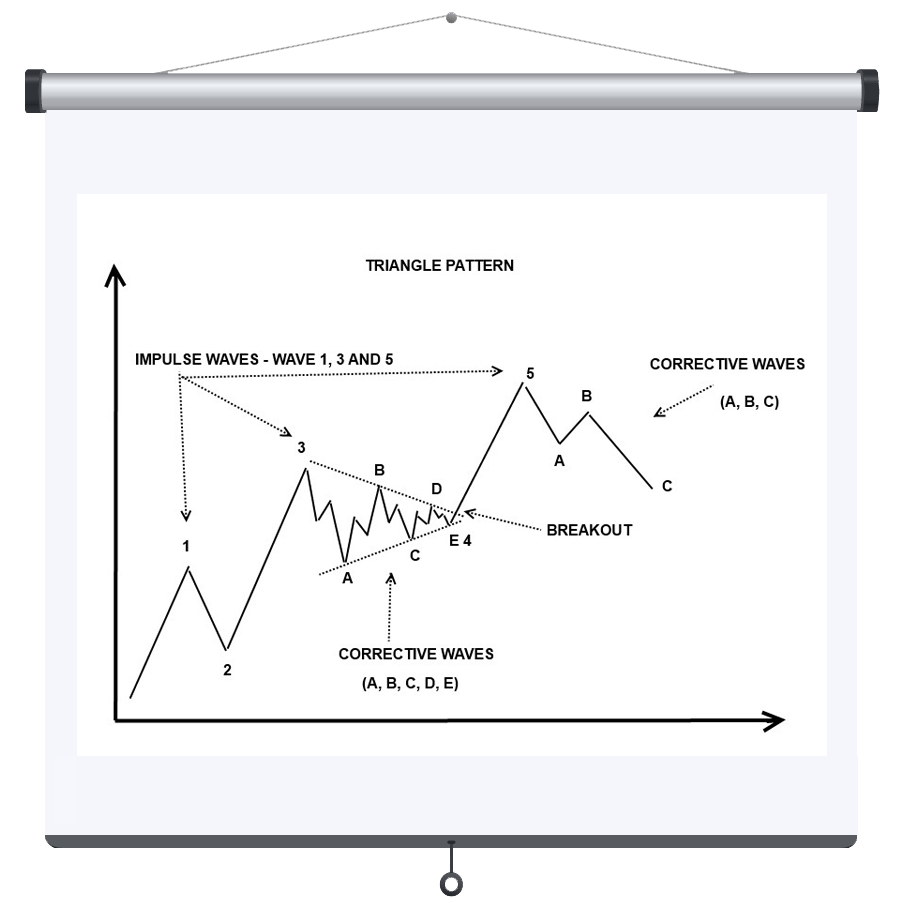
A Triangle reflects the balance of forces, this being the reason for its sideways movement and decreasing volume or volatility during its shelf life. A Triangle is also a sign of a sustained swing which is awaiting its turn. It contains five overlapping waves which subdivide as a 3-3-3-3-3 Structure and are labeled as A-B-C-D-E, which in turn subdivide as Zig-Zags or Flats. A Triangle is noticeable by connecting the termination points of Wave A with C, and B with D, with Wave E well known to overshoot the A-C connection line. Most of the times its lines are converging, except for the Expanding Triangle where the lines are diverging.
Triangles come in three types: Contracting, Barrier & Expanding.
Triangle locations:
Wave 4 of an Impulse
Wave B of an A-B-C Corrective
Wave Y in a Double Three
Wave Z in a Triple Three
A very important rule and a guideline when counting waves is that Triangles do not form in a Wave 2 position and represents a Continuation Pattern for the dominant trend.
Contracting Triangle
Characteristics:
3-3-3-3-3 Sequence within converging lines: A with C, and B with D
Upper line is declining, lower line is rising
Waves C and E never travel beyond the end of Wave A
Most common type of Triangle Pattern, around 50% of all cases
Barrier Triangle
Characteristics:
3-3-3-3-3 Sequence
Outer line flat and inner line pointing as a trend continuation
Waves C and E never travel beyond the end of Wave A
Waves B and D end at the same level on a horizontal line
Forms moderately, around 25-30%
Expanding Triangle
Characteristics:
3-3-3-3-3 Sequence with diverging lines
Upper line rising, lower line declining
Wave C travels beyond the end of Wave A and Wave D travels beyond the end of Wave B
Wave E is the strongest swing and ends at the connecting diverging line of Waves A and C
Its appearance is modest, around 20-25%
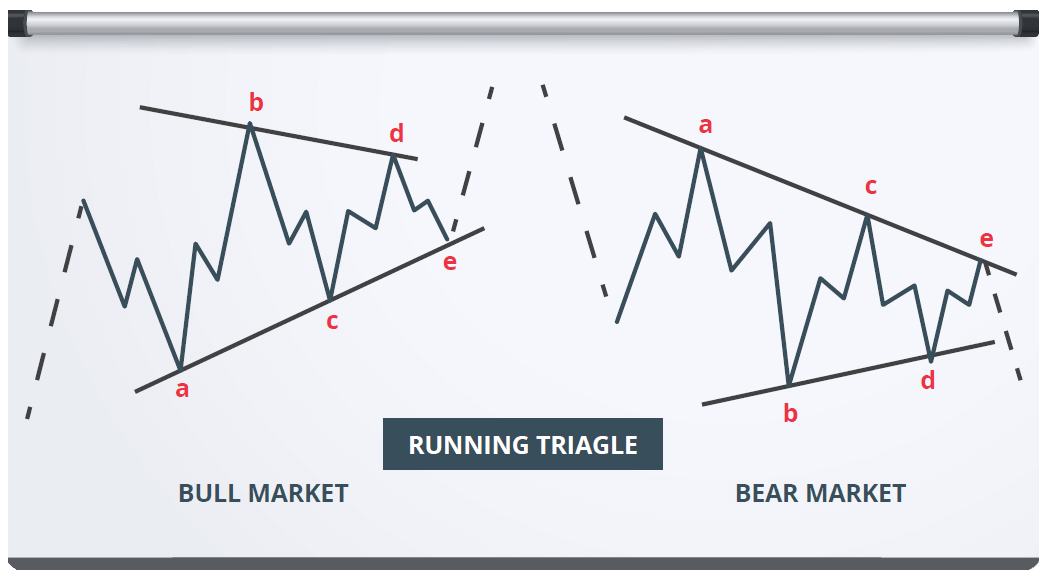
It is extremely common for Wave B of a Contracting Triangle to exceed the start of Wave A and to show a ‘’fake break-out”.
This structure is called the Running Triangle and it appears on the charts frequently.Running Contracting Triangle
Characteristics:
3-3-3-3-3 Sequence within converging lines: A with C, and B with D
Wave B travels beyond the start of Wave A
Upper line is declining, lower line is rising
Waves C and E never travel beyond the end of Wave A
Most common among Contracting Triangles
When ready to level up…
[btnsx id=”17550″]
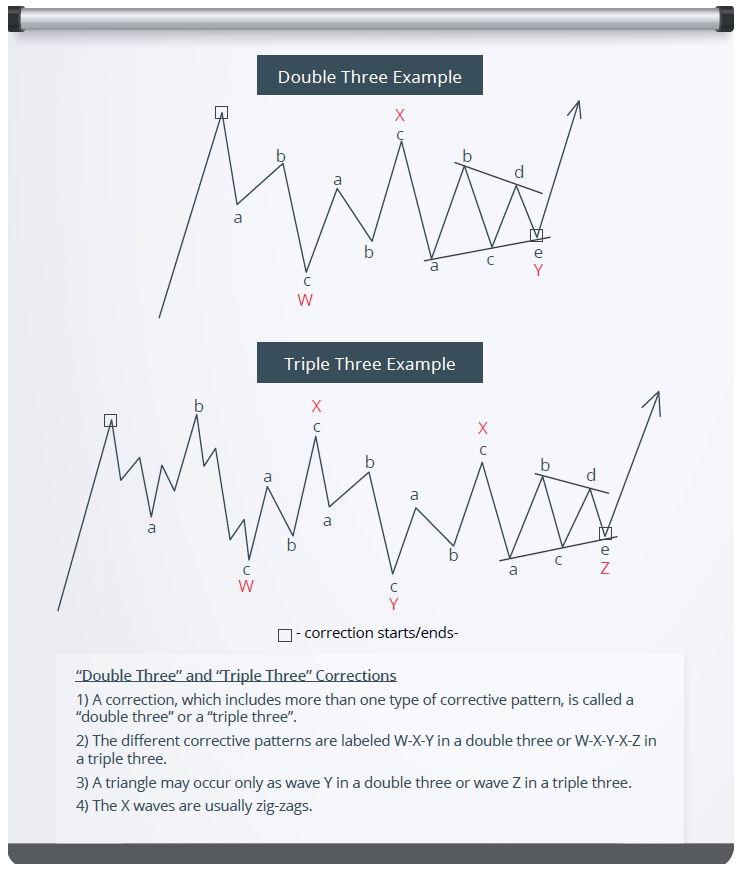
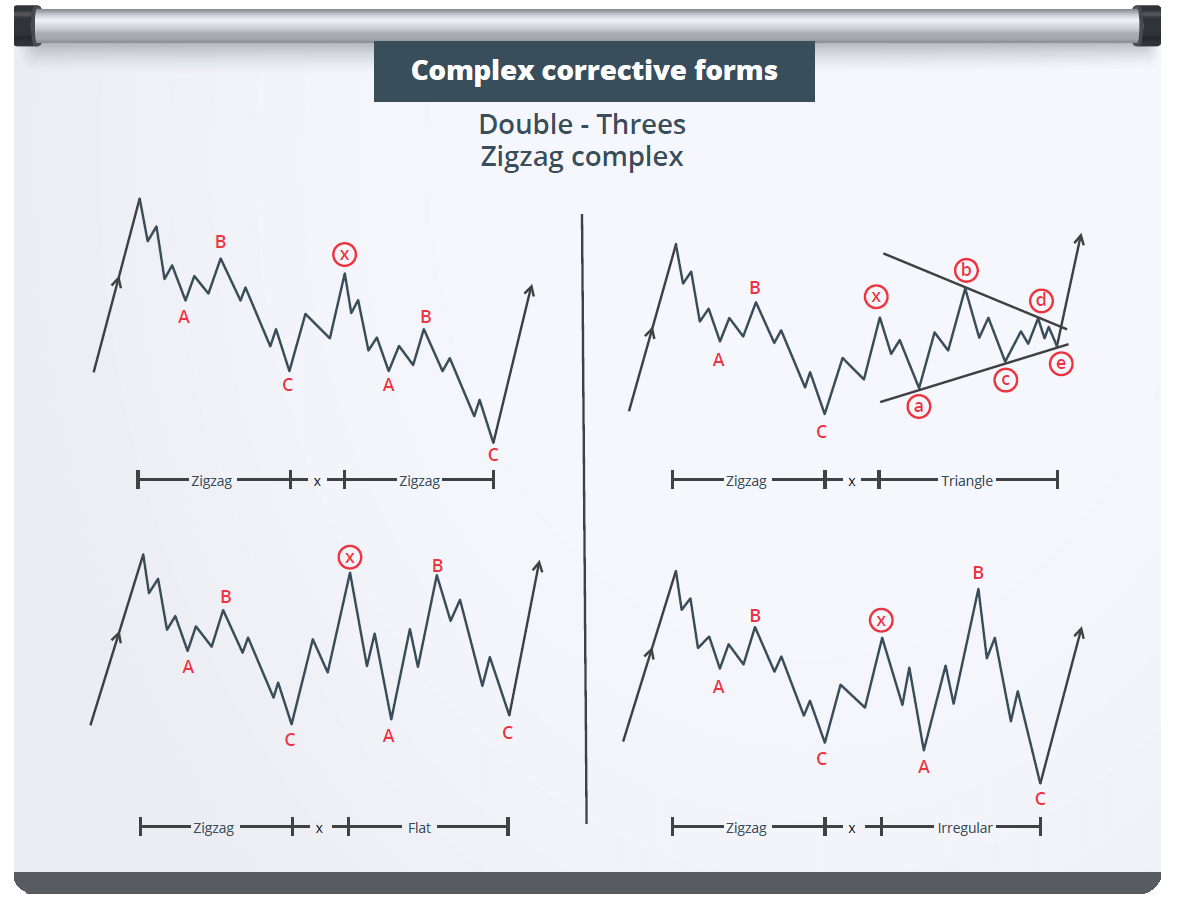
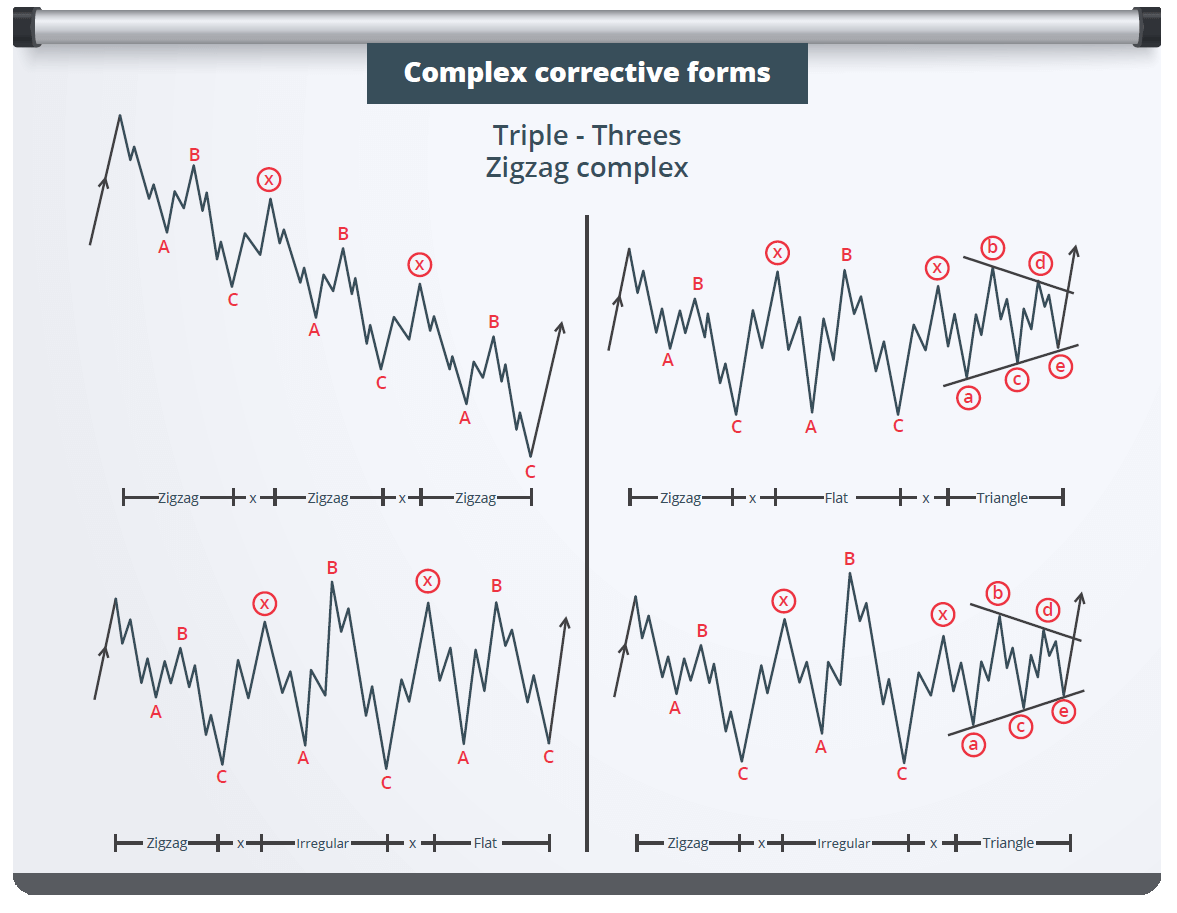
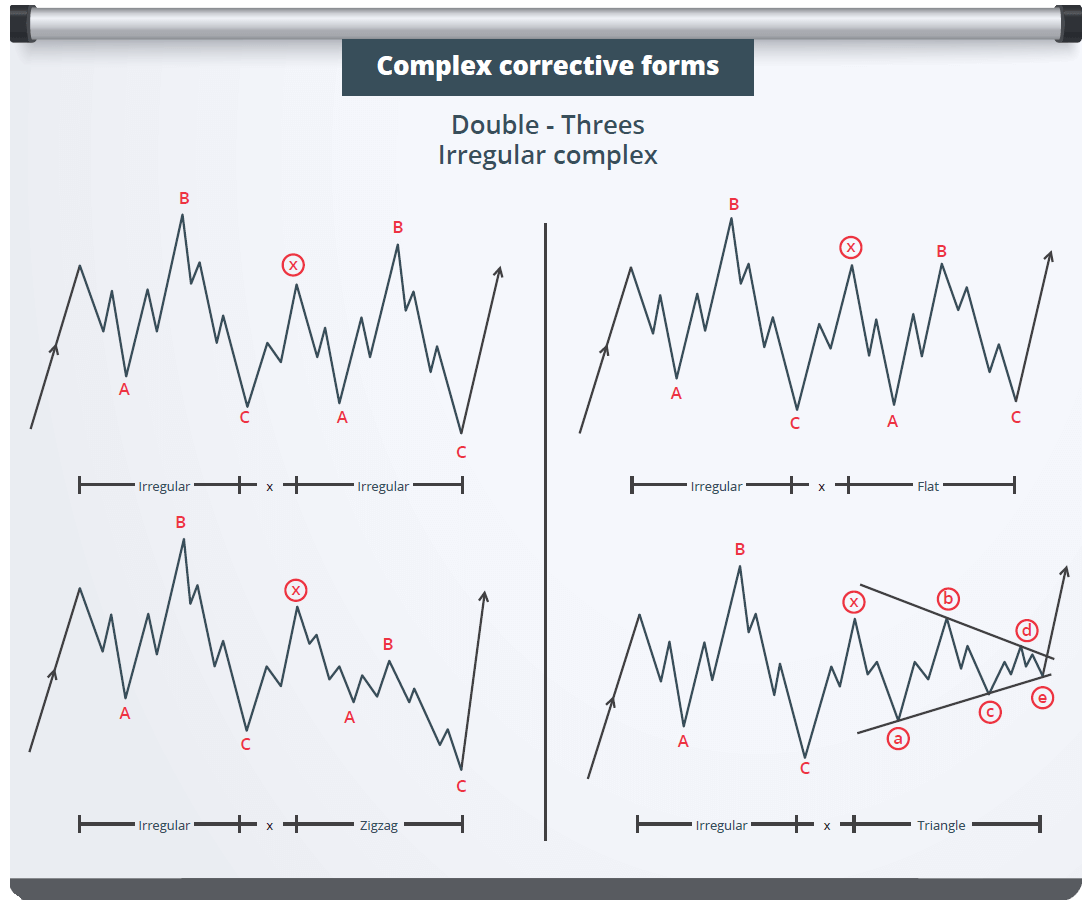
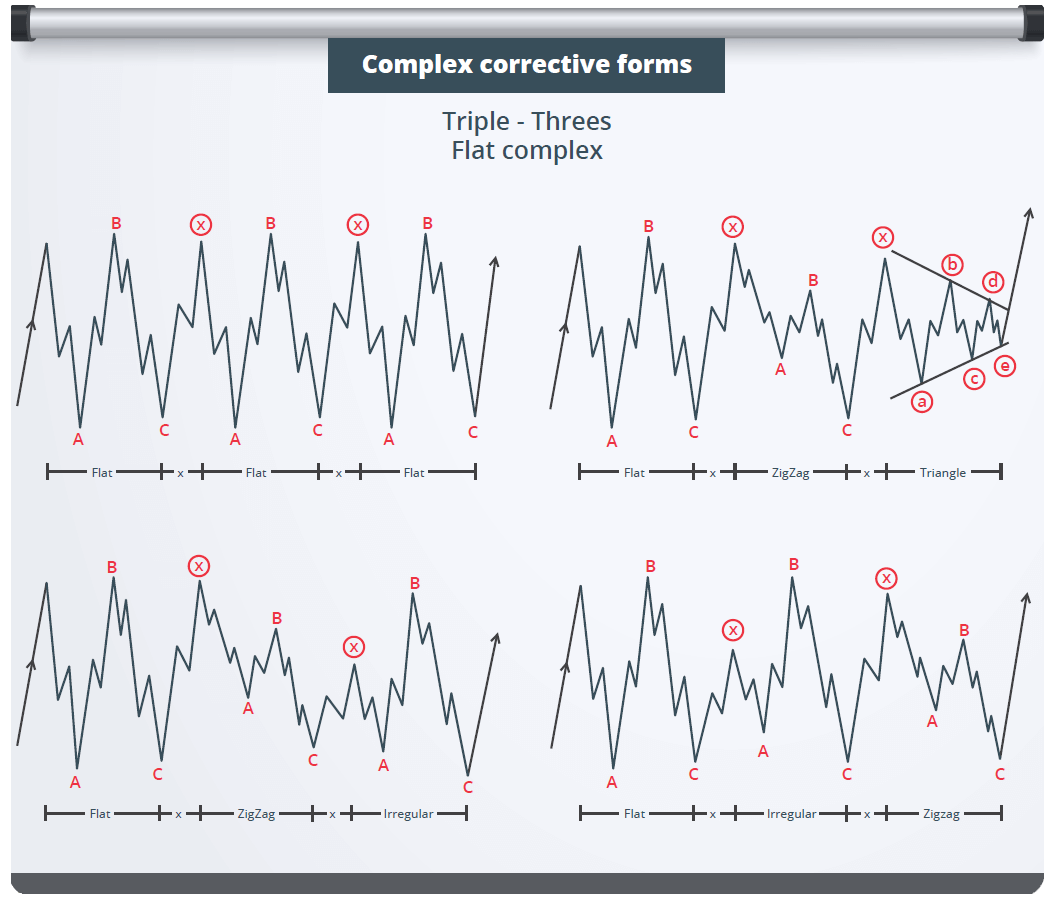
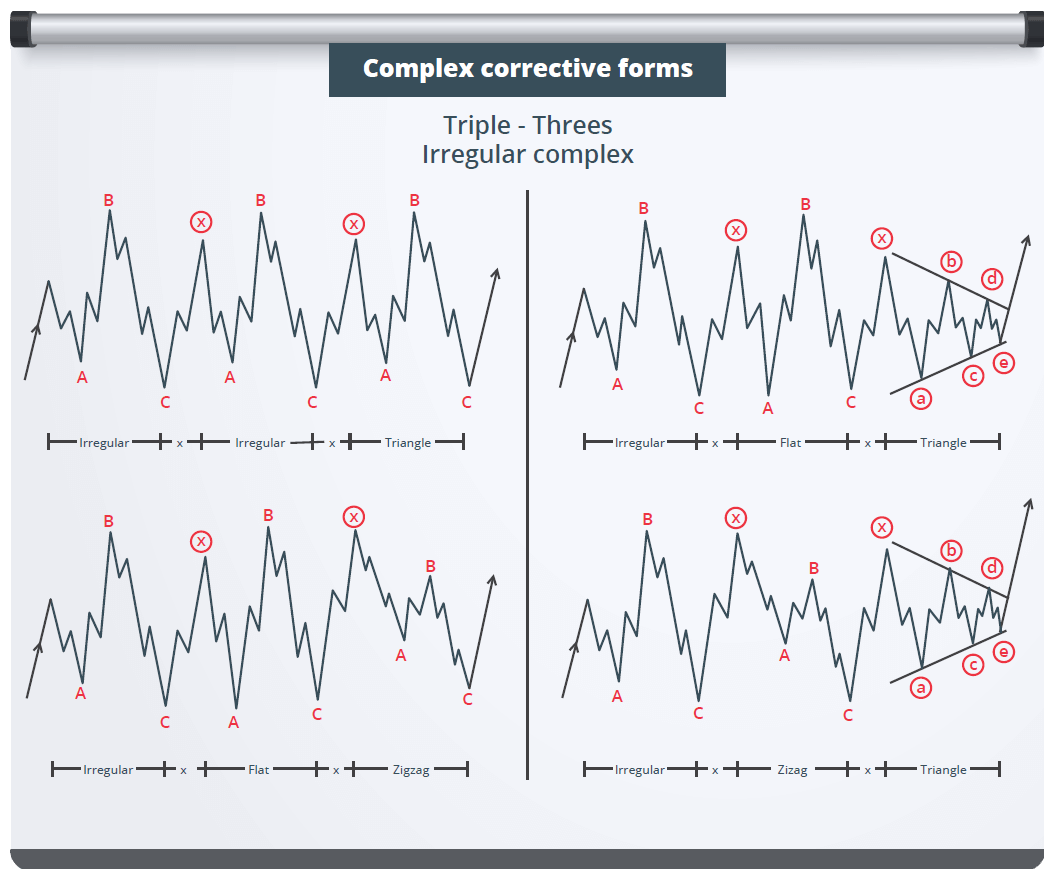
COMBINATIONS (COMPLEX) PATTERNS
R.N. Elliott intelligently referred to these extended sideways corrections as ‘’double’’ and “triple threes”. Combinations are composed of corrective patterns such as Zig-Zags, Flats and Triangles, which are linked through a ‘’bridge”, Wave X. This ‘’bridge” acts as an interruption (separation) and as a corrective upon a corrective pattern, hence the reason for its famously known ‘’fake break-outs” or temporarily ‘’indecisions’’ of the Market. These Complex Structures require advanced pattern recognition.
Combinations are labeled with letters, W-X-Y in a Double Three and with W-X-Y-X-Z in a Triple Three.
In a Complex Structure the final leg would always act as the decisive piece, therefore a triangle is an allowable final component, located in Wave Y in a Double Three or in Wave Z in a Triple Three.
Combinations – Complex Structures
Characteristics:
3-3-5 or 3-3-3-3-5 Sequence with each leg acting as a Pattern
Waves W is always a ‘’three’’ (Zig-Zag or Flat)
Wave X is correcting a correction and sometimes takes a Triangle form in a Double Three
Wave X usually takes a Zig-Zag or Flat form in a Triple Three
Wave Y is often a ‘’three’’ but could also appear as a Triangle in a Double Three
Wave Z is usually a Triangle in a Triple Three
Appear mostly at key levels (tops or bottoms) after sustained Extensions and represent signs of decisive swings
Usually form in a Wave 4 position and very rare in a Wave 2
Triangles in Double or Triple Threes act as final pieces for the structure
Any Corrective Pattern (three) can participate in a Double or Triple Three Structure
Triple Three Structure would rarely form
Tip: After a ‘’three’’, if the next swing would fit as ‘’too small’’ and would unfold in a shorter amount of time to be considered as the entire swing, it’s possible that a Combination would take place.
When ready to level up…
[btnsx id=”17550″]
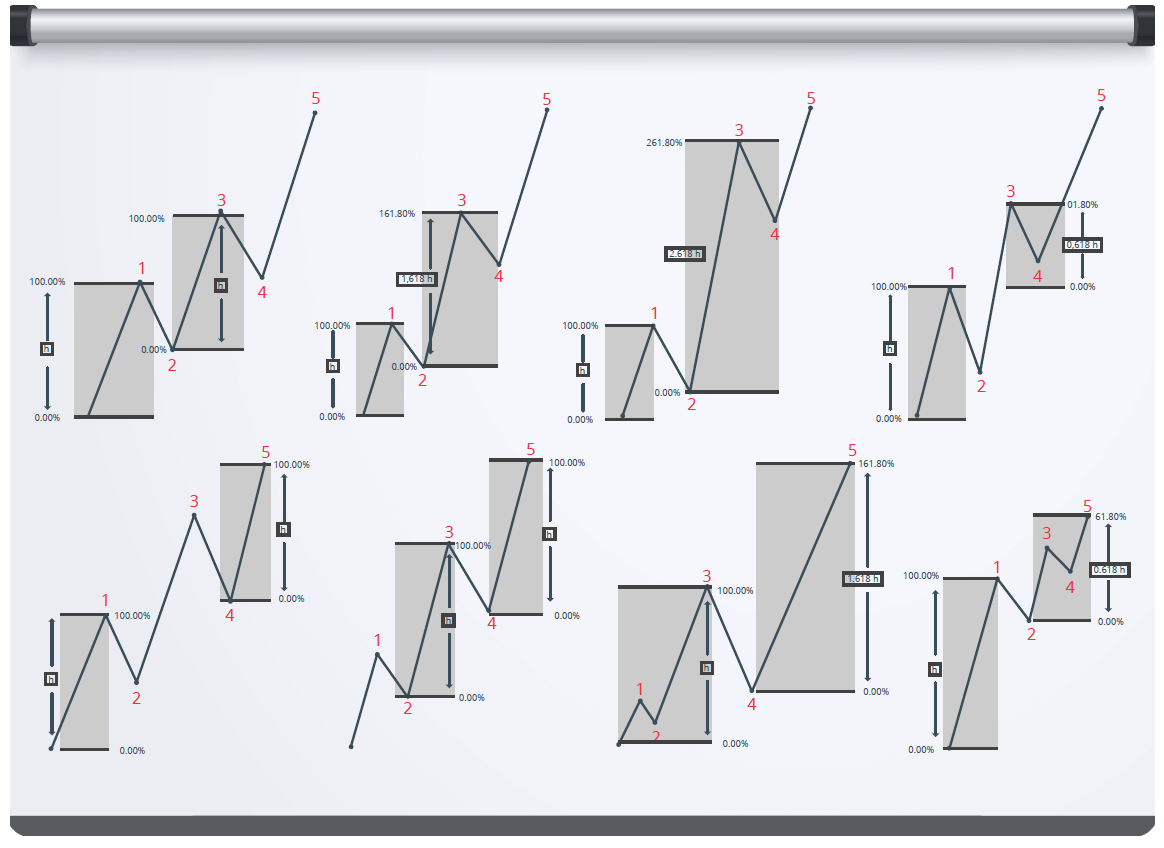
Impulses and Corrections relate to one another with the Fibonacci Sequence and the Fractal Pattern. The Golden Ratio is often used by traders along with specific charting tools such as Fibonacci Retracements and Fibonacci Extensions in order to measure an Impulse with its Correction, this way projecting possible upcoming swings. This method often puts Wave Traders in the “ahead of the crowd” position.
The picture below illustrates types of Extensions and Fibonacci Projections, in different stages of Impulses.
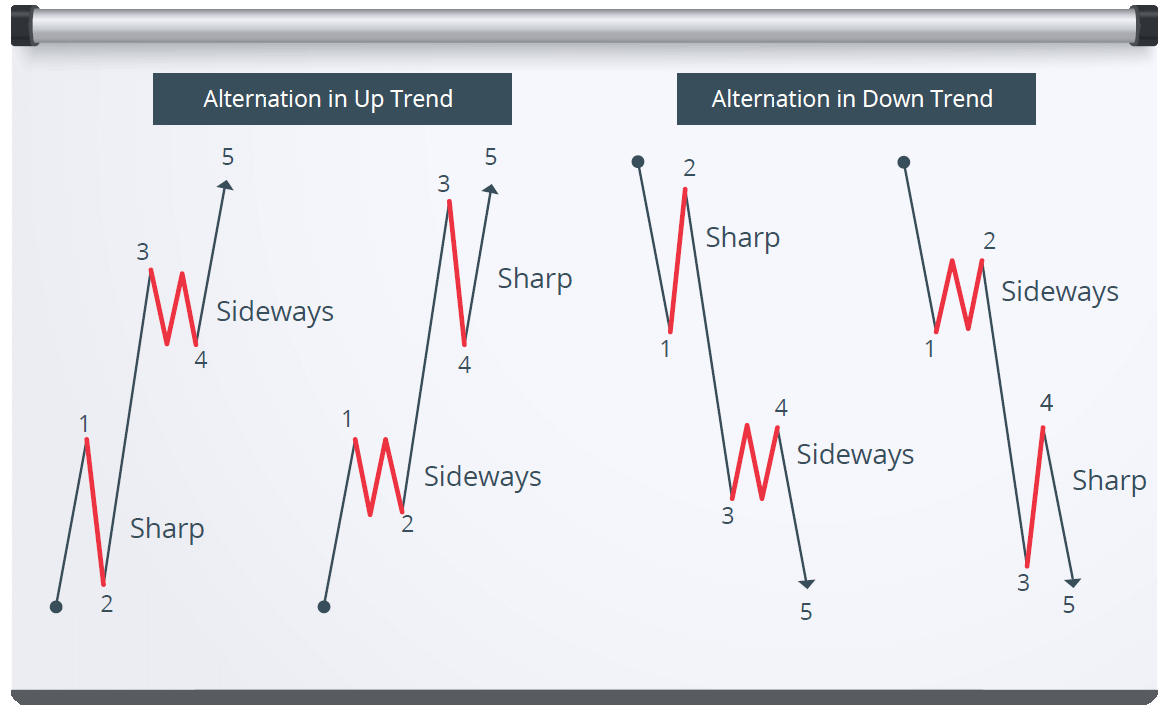
Elliott pointed out that Alternation is practically a law of the Markets. Alternation gives a valuable notice of what to expect or what not to expect when analyzing wave formations. A difference in corrective structures occurs in order for a certain balance to be kept, for example: if Wave 2 of an Impulse presents a Sharp Correction (Zig-Zag), then the analyst would expect Wave 4 to be a Sideways Correction, and vice versa. Most Wave Traders use Alternation not as a prediction tool, but mostly as an elimination tool.
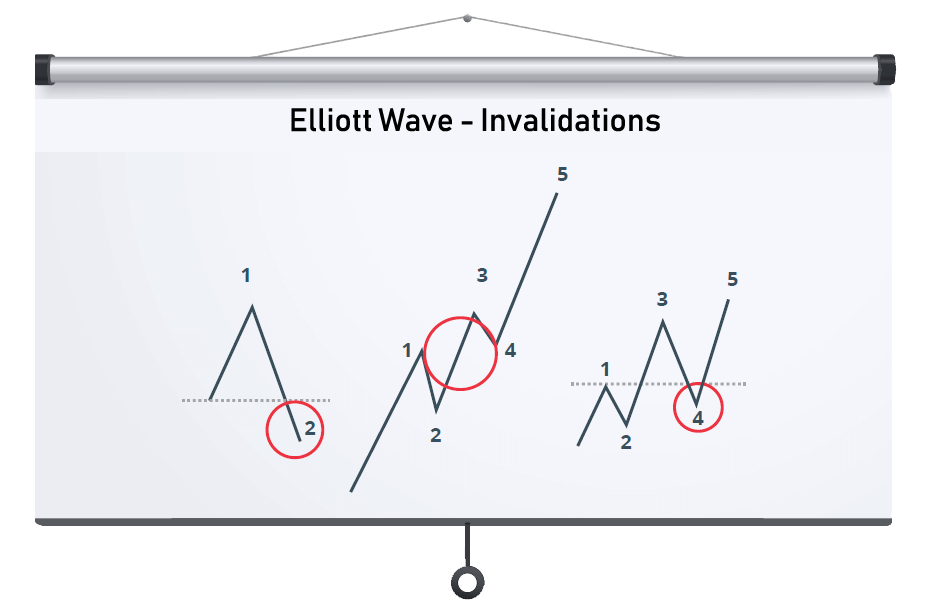
The Elliott Wave Principle offers exceptional value and it is indeed an exercise in probability. Wave Traders are often one step ahead of the crowd because when the Market would change the direction, then they caught the turn. If the Market would move beyond the acceptable points and cause an “Invalidation” of the Wave Count, then this would mean that some of the rules were broken, which in turn would lead the Wave Trader to reexamine the structures and determine the next best interpretation, thus preparing themselves psychologically.
Elliotticians often use what it’s called an “Alternate Count” besides their Main Count so that they would be prepared for other scenarios and also be aware when a change occurs. Structures can develop in multiple ways as explained in this course, therefore, an agile mind is recommended when counting waves. Structures also “reveal themselves” so when the Wave Trader finds him/herself in a place where there is no clear or preferred interpretation, it is best to wait until the structure reveals, this way the accuracy and confidence would increase, leading towards higher probabilities.
When ready to level up…
[btnsx id=”17550″]
Dear valued reader,
I would like to thank you for taking the time to go over the material presented in this course. I hope you found the information valuable and that it would be useful when charting.
Using the Elliott Wave Principle requires a sharp mind and lots of patience, but it is rewarding, nothing better than to be ready for that Impulse. It is indeed challenging but nevertheless it’s something else, something that when mastered, it becomes a priceless “ace” resting in the right hands.
Should you choose to possibly expand your knowledge or just to have a chat, you may book an appointment by using the buttons below.
You may follow Lionheart Elliott Wave Analysis via the Services and Memberships.
Many pips ahead,
Like this written Elliott Wave Course?
Write a review!
[btnsx id=”5755″]
Ready for a Membership?
[btnsx id=”7660″]
When ready to level up…
[btnsx id=”17550″]

Elliott Wave … Elliott Wave … Elliott Wave …