

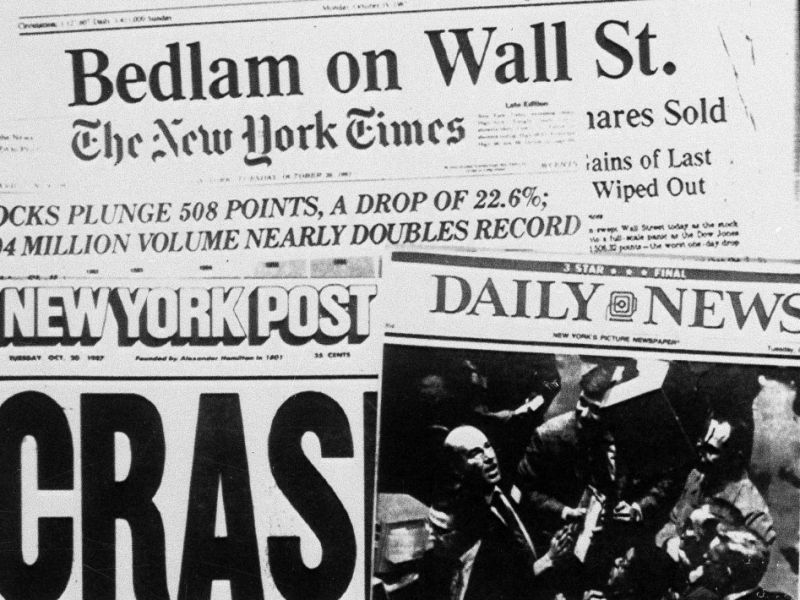
Battle of the Charts & Risk-off August
Elliott Wave Technical Analysis
Forex – Metals – Energy – Indices
“Another wave of volatility could be around the corner, as the VIX is most probably going to spike once more, as it did in February 2018. This will shock the markets.
The recently posted “VIX Spike – US Indices & Flash-Crash” article seems to be on track for another big move on Indices.”
Introduction:
The Markets have been trading within complex structures within the first quarter of 2018. As soon as the 2nd quarter started, new trends commenced and impressed traders with sustained impulses.
During the 1st and 2nd quarter of 2018, EUR and Metals lost considerable ground due to the USD’s strength, with EUR/USD reaching the 1.1510 support after approx. 1000 pips decrease in value. With the start of the 3rd quarter, it now seems to be developing a sideways consolidation on the support, and the next big moves could be decisive for EUR’s future.
XAU/USD (Gold) unfolded with a complex corrective structure during the 1st quarter and by entering the 2nd quarter, the precious metal broke through the 1285.00 daily support or decisive levels, then also breaching further on the down-side. Moving into the 3rd quarter, Gold perforated through the weekly support trend-line, under which it seems to be consolidating before a possible next move.
WTI (Crude Oil) continued the sustained rise in prices per barrel with the 1st quarter of 2018. Moving into February, WTI felt the volatility spike as well, showing a sharp decline, from $66.50 per barrel towards $58.20 per barrel.
Continuing with the 2nd quarter and entering the 3rd quarter, WTI reached as high as $75.25 per barrel, but it seems to be having difficulties sustaining a bullish stance, as the aggressive sell-offs experienced along the way upwards could indicate further weakness before higher grounds.
Global Indices have taken a big hit in the 1st quarter, with the VIX (Volatility Index) spiking in early February. Because of the volatility spike and the return of the sellers, US Indices gave in and the bull market was interrupted with a shocking drop. Dow Jones and SNP500 lost approx. 3500 and 350 points respectively, in just one trading week.
Since the 1st VIX spike the Market has been mostly consolidating, especially when it comes to US Indices. Since February 2018 until the first part of the 3rd quarter, Dow Jones and SNP500 managed to regain those huge losses and are currently showing possibilities of another aggressive dip, like the previous shock-wave.
As per the current Cycles and Elliott Wave counts, the overall position of the Market seems to be located at a somewhat crucial point, a juncture.
The Market is showing considerable signs of a shift in directions, as the VIX could be preparing another spike in volatility. If such a scenario would occur, then this could be translated into a continuation of the uncertainty which covered the markets for the first half of this year. It could also lead towards extended risk-off periods and aggressive swings, for multiple markets.
Wave Counts posted below are labeled under the presumption that the current and overall position of the Market reflects a Complex Corrective Cycle.
From a technical stand-point, and as per the explanations or illustrations below, the current structures seem to be aligned for a possible shift in directions and/or continuation of the larger degree Patterns.
In the lines to come, an in-dept technical analysis is shared, with the views to be treated as medium and/or long-term possible scenarios or forecasts.
The technical analysis has been realized under the presumption that another spike in volatility could occur soon, and that a period of uncertainty (risk-off) would be a possibility. As an effect of such scenario possibly occurring, markets would be affected, and the present analysis points towards possible scenarios for multiple sectors.
The analysis and insights shared with the present content are not to be treated as an investment advice or as a solicitation to trade. Real risk behind trading in the financial markets needs to be carefully considered.
Markets analyzed:
Forex:
- Dollar Index (DXY)
- EUR/USD
- USD/JPY
Precious Metals:
- GOLD & SILVER Ratio (XAU/XAG)
- GOLD (XAU/USD)
- SILVER (XAG/USD)
Energy:
- Crude Oil (WTI)
Indices:
- Bull Market – Wave Count & Analysis
- VIX (CBOE Volatility Index)
- SNP500
- DOW30
- NAS100
- DAX30
Elliott Wave Technical Analysis
VIX – CBOE Volatility Index
VIX – Weekly Chart (picture)

VIX (Volatility Index) seems to be preparing for another spike in volatility.
With the start of February 2018, VIX jumped. That spike in volatility could represent the first piece of a series of similar events.
This indicator is used by analysts to measure the state of buy-sell investors’ emotions, complacency versus the fear effect. In simple terms, a rise in the VIX would or bring with it a sharp fall in Stocks and/or Indices.
A decrease in the VIX represents the periods when market participants are in the state of greed, being complacent and euphorically enjoying the bull market. A rise in VIX indicates a period of uncertainty, risk-off events that impact the markets directly and suddenly. Such spikes bring with them a fear effect, when investors are beginning to feel worried for the market’s destined directions.
VIX – Weekly Interactive Chart
VIX – 2H Chart (picture)
Zooming into the 2H chart, the February 2018 VIX spike has been labeled as the 1st leg of an Intermediate Degree bullish ABC formation.
Intermediate (A) (orange) presents a three swings sequence with its Minor ABC (red) sub-waves, in which Minor C (red) is unfolding with an impulsive swing.
Moving into Intermediate (B) (orange) and the corrective patterns, the entire structure has been labeled as a Zig-Zag, with a Leading Diagonal in Minor A (green), an Expanded Flat in Minor B (green) and an Impulse sequence in Minor C (green).
The Correction in Intermediate (B) (orange) seems to have ended, and if this scenario would be correct, then VIX could commence a larger degree rise in an Impulsive sequence.
The rise labeled as Minor 1 (red) exceeded the previous lower-high and this could indicate that an Impulsive sequence could be a possibility. Minor 2 (red) unfolded with a simple ABC (turquoise) correction, showing an Ending Diagonal in its last leg.
Should the VIX be destined to spike once more, it could affect the markets more than the previous one did, as Intermediate (C) (orange) could present an Extension in its Impulse.
Such imminent scenario would be invalidated or delayed only by a decrease below the 11.50 levels, as a wave two cannot surpass the start of a wave one.
Looking back on the previous volatility spike and towards the way this affected the markets, it can be noticed that, during those volatile events, the reactions were divided.
The USD remained stable towards strong, but the YEN was treated by investors as the true safe-haven asset. Metals and EUR lost considerable ground, while global Indices have shown historical one-week drops.
By looking into each market, one would notice some possible patterns and correlations with the February 2018 bears return.
VIX – 2H Interactive Chart
FOREX
Dollar Index (DXY) – Elliott Wave Analysis
Dollar Index (DXY) – Daily Chart (picture)
The USD has been losing ground ever since Jan 2017, when a 1 year down-trend started. During this period, EUR/USD and XAU/USD enjoyed bullish trends, but USD/JPY shown weakness.
The down-trend on DXY has been labeled as a primary Degree Wave A (blue), the 1st leg of an ABC Primary Degree Structure.
This down-trend shows a Leading Diagonal in Intermediate (A) (turquoise), a Zig-Zag (ABC orange) in Intermediate (B) (turquoise), and a sustained Impulsive Bearish Intermediate (C) (turquoise). Intermediate (C) (turquoise) is showing an extension, with a 5 swings sequence within its Minor Sub-waves (red 12345).
At this stage, it seems like the USD reached its bottom for 2018, as per the bullish swings which started in the second half of Feb 2018.
The current Wave Count on the DXY paints a picture in which the USD could be currently trading within an Intermediate Degree (A)(B)(C) (turquoise) Structure.
The Bullish Sequence which started after the February 2018 bottom has been labeled as Intermediate Degree Wave (A) (turquoise), which, if correct, would pose as the first leg of Primary B (blue).
The 5 Swings Sequence present in Minor C (orange) seems to have ended, and with Minor C (orange) ending, so would Intermediate (A) (turquoise).
DXY found resistance around the 95.50 Levels, which are located close to the 50% Fibonacci Retracements of the previous Bearish Primary A (blue) down-trend.
Considering that the Intermediate (A) (turquoise) finalized its cycle, this would lead towards a Bearish Corrective Pattern within Intermediate (B) (turquoise), which can be labeled with a 3 Swings Sequence.
Intermediate (B) (turquoise) shows a sharp decline in Minor A (red) and a Complex Correction in Minor B (red). Minor C (red) would be considered as a possibility for a next swing, and this is because an imminent end of the entire Intermediate degree correction would not pose as the best interpretation. Time-wise, Intermediate (A) (turquoise) would need to be matched and/or exceeded by Intermediate (B) (turquoise), a detail which is currently missing.
Minor C (red) could be looking for the 92.00 vibration zone but could also target the 91.10 Levels if an extension would take place.
If the projected analysis will unfold as mentioned, then DXY would possibly turn bullish and create a new high for the year, as an even more powerful Impulsive swing in Intermediate (C) (turquoise) would be in focus, to complete Primary B (blue) structure.
The focus at these current points would be Minor B (red), as a new high could invalidate the overall bearish continuation and change the pattern. As an alternate view for an immediate bullish continuation, Intermediate (B) (turquoise) could reflect as a Triangle formation. The probability for such scenario is slightly decreased, however, it could be kept in mind as a variable
DXY – Daily Resistance & Support:
- Resistance: 95.00 / 95.50 / 96.00 / 98.00 / 102.00
- Support: 93.90 / 92.85 / 92.00 / 91.10 / 90.00
DXY – Summary:
- Expected to commence a Bearish Impulse at or around 95.00 or 95.50 Levels
- Bullish Impulse expected around 92.00 / 91.00 Levels
Dollar Index (DXY) – Daily Interactive Chart
EUR/USD – Elliott Wave Analysis
EUR/USD – Daily Chart (picture)
EUR/USD has been enjoying a sustained up-trend during 2017, while the USD depreciated. A full year of bullishness ended in the middle of Feb 2018, when the EUR softened and started a complex consolidation which was followed by a major sell-off, depreciating approx. 1000 pips.
The 2017 aggressive rise has been labeled as an Intermediate Degree (A)(B)(C) (turquoise) Bullish Sequence, thus completing a Cycle Degree, labeled as Wave W (blue).
Moving into 2018 and the 1st quarter, EUR/USD loss of approx. 1000 pips has been labeled as Intermediate (A) (red), the first leg of a Complex Structure, more exactly a Cycle Degree wave X (blue).
At this stage, the first bearish swing labeled as Intermediate (A) (red) appears to have completed, and EUR/USD seems to be gaining Support around 1.1500 Levels.
Those levels appear to pose significant importance, as the current structure in Intermediate (B) (red) is showing the possibility of an ABC type of pattern, with a Flat formation as a possible scenario in Minor B (light blue).
If the current labeling would turn out to be correct, then this would lead EUR/USD towards a Bullish 5 Swings Sequence journey, which would reflect as Minor C (light blue) and the end of the larger degree Intermediate (B) (red).
A possible confirmation of such medium-term bullish sequence could be a break-out of the 1.1800 Pivot and could indicate further up-side.
As a preferred scenario, Minor B (light blue) has been labeled as a Flat pattern because the 38.2% Fibonacci retracement of Cycle W (blue) historically posed as a vibration zone.
From an advanced technical perspective, the 1.1500 levels would be in focus for a possible support, as a bearish breach or a continuation beyond the 1.1500 levels would invalidate such scenario. In a Flat scenario, the 1.1500 levels would be of high importance as it could be the decisive support.
A bearish breach of the 1.1500 levels could translate into more weakness ahead for the EUR/USD, while a bullish break-out of the 1.1800 levels could translate into more ups-side ahead, and the preferred scenario’s outlook.
In case of bearish consistency proven and an imminent bearish breach to occur, then this scenario could translate as a decisive change in patterns, and EUR/USD could be destined for significant down-side.
Should the Bullish Sequence be determined to commence, it could test the 1.2000 or even 1.2150 levels, which could pose as a Strong Resistance. The mentioned 1.2150 Levels reflect 61.8% Fibonacci Retracements of the 1st Quarter fall but could also turn out to be the right shoulder within a complete Head & Shoulders Formation.
If the Head & Shoulders formation would become true and the 61.8% Fibonacci Retracements of Intermediate (A) (red) would hold, and the Bearish Sequence to be destined for a continuation, then Intermediate (C) (red) could even reach as low as 1.0800, because the Gap left behind by the French Elections remained unfilled.
EUR/USD – Daily Resistance & Support:
- Resistance: 1.1800 / 1.2000 / 1.2150 / 1.2300 / 1.2800 / 1.2500
- Support: 1.1500 / 1.4450 / 1.1310 / 1.1100 / 1.0800 / 1.0450
EUR/USD – Summary:
- Expected to commence a Bullish Sequence which could reach 1.2000 or even 1.2150 Levels
- Bearish Impulse expected at or around 1.2150 Levels
EUR/USD – Daily Interactive Chart
USD/JPY – Elliott Wave Analysis
USD/JPY – Daily Chart (picture)
USD/JPY benefited from the crucial 100.00 Levels and gained an important Support during 2016’s summer time. This resulted in USD/JPY getting a sling-shot effect and delivering an impressive 2000 pips (approx.) Bullish Rally. These Swings have been labeled as Primary W (blue).
Moving into 2017, USD/JPY started crumbling down, unfolding with a very complex Corrective Structure, in what appears to be the Primary Wave X (blue).
This Complex Bearish Correction lasted a considerable amount of time, ending near the end of March 2018. That is when USD/JPY honored the Golden Ratio and hit the 61.8% Fibonacci Retracements of Primary W (blue), resulting in the decisive up-lift and starting an Intermediate Degree (A)(B)(C) (turquoise) Sequence, which has been labeled as Primary Y (blue.
At this stage, it seems as if Intermediate (A) (turquoise) finalized at the 111.00 Levels, reversing rapidly and possibly unfolding with a Complex Correction in Intermediate (B) (turquoise).
The structure in Intermediate (B) (turquoise) seems to be developing within a Rising Channel and this could complicate the readability.
Minor B (red) exceeded the start of Minor A (red), which could lead towards either an Expanded Flat or a Running Flat scenario for its corrective pattern.
In a Running Flat scenario, the Rising Channel would agree with a possible support grated at the 110.00 levels, which reflect the 100% Fibonacci Extensions of Minors A & B (red) for the possible end if Minor C (red). However, a bearish breach of the lower rising trend-line could lead towards an Extension in Minor C (red) and the next best interpretation for a possible support could be the 108.00 or even 107.00 levels.
Should this scenario be correct, then USD/JPY would be expected to resume the overall up-trend with an Impulsive Bullish Sequence, labeled as Intermediate (C) (turquoise).
According to the Daily Structure, if USD/JPY would gain Support once more and commence a Bullish Rally, then this Swing could reach as high as 118.00, or even 124.00 Levels.
USD/JPY – Daily Resistance & Support:
- Resistance: 112.00 / 113.00 / 114.50 / 118.00 / 124.00
- Support: 110.00 / 108.00 / 107.00
USD/JPY – Summary:
- Expected to continue with the Bearish Correction which could complete at or around 110.00 Levels, but could also reach 108.00 Levels
- Bullish Impulse expected at or around the 110.00 or 108.00 Levels
USD/JPY – Daily Interactive Chart
PRECIOUS METALS
Gold & Silver started 2016 with a bang, gaining supports and delivering outstanding Bullish Swings, reaching their tops during the summer of the same year, and hitting levels which were not seen again since then.
The Wave Counts shared below are labeled under the presumption that Metals were trading within Complex Corrective Patterns. This is because of the conflict of degrees and conflicts of corrections.
Since July 2016 and until February 2018, Precious Metals have been unfolding with sideways movements, with no clear directions, without sustained Impulsive Swings, developing swings which were mostly correcting one another.
After almost two years of choppy and sideways movements, the Precious Metals sector seems to be slowly returning towards the Bullish side, as multiple technical factors seem to be pointing towards that scenario.
The interesting thing which could be pointed out would be that Silver looks as if it could outshine Gold if a Bullish Sequence would occur in the 3rd of 4th quarter of 2018.
Gold / Silver Ratio – XAU/XAG – Elliott Wave Analysis
XAU/XAG – Monthly Chart (picture)
The Gold/Silver Ratio chart suggests that the demand of Silver could be higher than the one for Gold.
The current Elliott Wave Count on the Monthly Chart would place XAU/XAG in a Primary C (blue) Impulsive Bearish sell-off, within a Cycle Wave Y (orange), of a higher degree Super-Cycle Wave (B) (purple).
XAU/XAG seems to be channeling within what appears to be an Ending Diagonal in the last 5th Minor Wave (blue), within Intermediate (C) (green) of the even larger degree Primary B (blue) Wave.
The pink horizontal lines represent decisive Support and Resistance Levels.
The 86.00 Levels could be treated as the Resistance, under the scenario in which XAU/USD would unfold the last Bullish Swing needed for the completion of the potential Ending Diagonal.
The 74.00 Levels could be treated as the decisive Support and a Bearish Breach could confirm the down-trend.
XAU/XAG – Monthly Resistance & Support:
- Resistance: 86.00
- Support: 74.00
XAU/XAG – Summary:
- Expected to start a Bullish Swing from the current 79.00 Levels and complete the Ending Diagonal pattern at or around 86.00 Levels
- Bearish Impulse expected at or around 86.00 Levels
XAU/XAG – Monthly Interactive Chart
XAU/USD – Elliott Wave Analysis
XAU/USD – Daily Chart (picture)
XAU/USD got catapulted on the up-side back in December 2015, commencing an impressive Bullish Sequence and ending these moves in the summer of 2016. The most it reached was 1375.00 Levels and these figures have not been seen again since then.
The 6 months of Bullishness were sharply followed with the same amount of time of aggressive Bearish sell-offs, resulting in a Complex 3 Swings Sequence which hit as low as 1125.00 Levels in December 2016.
Following the sharp drop in Gold prices, XAU/USD started to rise again for an entire year, unfolding with a Pattern which does not appear to be sustained, as the previous Bullish Rallies were.
Due to this reason, and from an Elliott Wave perspective, XAU/USD Daily Structure seems to be revealing an ABC (black) Cycle degree corrective pattern.
The main focus would be Cycle B (black), which shows a Complex Corrective sequence, and this is due to multiple conflict of degrees in its Primary degree WXY (orange) sub-waves.
The reason behind the Complex Structure would be because the period from December 2016 until early February 2018 would reflect a Corrective Structure, attempting to correct the period between July 2016 and December 2016, which would also represent a correction. This leads towards a corrective pattern correcting a previous correction, hence the reason why Primary X (orange) unfolded within a Rising Channel, also the reason why the swings within it were not consistent or impulsive by nature.
Primary X (orange) structure has been labeled as a Complex Intermediate degree (W)(X)(Y) (pink), in a Double Three pattern.
The Bullish Corrective sequence which started from 1240.00 Levels back in December 2016, rose until the 1360.00 Levels, where XAU/USD faced a decisive Resistance. From early February 2018 and until present times, Gold price action movements unfolded with a Complex Structure within Intermediate (W) (turquoise). Within this degree, Minor Y (red) completely changed the outlook for this precious metal, pushing it aggressively towards volatile levels and dangerously moving XAU/USD into bearish territory.
With the 2nd quarter of 2018 nearly ending, Gold made a crucial decision at the 1285.00 levels, as the retest of the lower trend-line of the Rising Channel did not hold as a support. The following bearish break-out concluded into a major sell-off, one which could resemble the 2016 US Presidential Election.
Early in the 3rd quarter, XAU/USD also broke through the 1240.00 crucial support located at the weekly trend-line (red), which could be an even bigger bearish sign. The mentioned trend-line comes from December 2015 and December 2016 lows, where Gold instantly reacted with bullish impulses.
With the crucial 1240.00 levels broken, XAU/USD is most likely about to make another important decision.
The 61.8% Golden Ratio area revealed by the Fibonacci Extensions of Primary W & X (orange) could be treated as points of interest by both sides, bulls and bears.
From a bearish perspective, the breach of the weekly trend-line would pose as a favorable sign and Gold could be pointing towards further weakness until the 100% Fibonacci Extension Primary W & X (orange). However, due to the way the structures developed with complex swings within, a reaction could occur in a corrective bullish structure, before a continuation for the mentioned weakness.
The preferred scenario would suggest a possible Bullish Corrective Structure at or around the 1210.00 – 1195.00 range, as a retest of the red dotted trend-line could lead towards a rejection and a pattern continuation.
As for the area which could reflect as points of interest and vibration levels, the 1260.00 – 1300.00 zone could cause a bearish effect on the previous metal.
Cycle Wave B (black) Fibonacci projections for a possible completion of its Flat Pattern would reflect the 100% Fibonacci Extensions of Primary W & X (orange), where Primary Y (orange) would be expected to finalize.
From a long-term perspective, the 1115.00 levels could pose as points of interest for the bulls and the beginning of another cycle.
XAU/USD – Daily Resistance & Support:
- Resistance: 1250.00 / 1260.00 / 1300.00 / 1340.00 / 1380.00 / 1420.00 / 1480.00
- Support: 1210.00 / 1195.00 / 1160.00 / 1115.00 / 1080.00
XAU/USD – Summary:
- Expected to start a Bullish Corrective Structure in a three-swings sequence at or around the 1195.00 levels and possibly retest the 1260.00 – 1300.00 vibration area.
- Bearish Impulse expected around the 1260.00 – 1300.00 area, towards the possible retest of the 1125.00 December 2016 lows and the pattern’s completion.
- If all scenarios would turn out to unfold as expected and Gold would retest the 1115.00 levels, then that specific area could be seen by bulls as an opportunity for longs, which could even reach the 1480.00 levels in an Impulse.
XAU/USD – Daily Interactive Chart Chart
XAG/USD – Elliott Wave Analysis
XAG/USD – Daily Chart (picture)
XAG/USD enjoyed the sling-shot effect from the 13.70 Levels, in tandem with XAU/USD, back in December 2015. The aggressive buying and the Bullish Swings within Cycle Wave W (turquoise) reached as high as 21.00 Levels.
Since July 2016 until July 2017, Silver lost 78.6% on the Fibonacci Retracements of Cycle Wave W (turquoise). The Retracement performed under what appears to be a very Complex Structure within the Primary degree (purple). The Complex Structure has been labeled as a Triple Three, in a WXYXZ (purple).
Back in July 2017, the lowest readings seen were the 15.20 Levels, and that is where XAG/USD reacted instantly with a Bullish Swing, which has been labeled as Intermediate (A) (turquoise). This swing topped out at 18.00 Levels, where another Corrective Pattern began, labeled as Intermediate (B) (turquoise).
The Tringle formation in the second interruption caused by Primary X (purple) has been labeled with sub-waves, Intermediate degrees (A)(B)(C)(D)(E) (turquoise).
Primary X (purple) finalized its one-year Triangle formation with the ending of the 2nd quarter of 2018, and moving into the 3rd quarter, XAG/USD commenced a bearish impulsive swing, retesting the 15.20 Levels once more.
Silver’s current location, from an Elliott Wave standpoint, could reflect the first Intermediate (A) (orange), sub-wave of Primary Z (purple).
The current structure could leave room for another dip towards the 15.00 or even 14.75 Levels, as a Bullish Divergence would be needed to possibly begin the projected Intermediate (B) (orange).
Should the next moves honor the Bullish scenario, then Silver could commence a Bullish Corrective Structure, and reach / retest the 16.00 or even 16.75 Levels.
If Intermediate (B) (orange) projection would turn out to unfold as expected, with a three-swings sequence in a corrective manner, then the 16.00 – 16.75 range could pose as a Resistance and the possible trigger needed for primary Z (purple) to complete with the impulsive Intermediate (C) (orange).
From a long-term perspective, the 14.35 Levels could pose as points of interest for the bulls and the beginning of another cycle.
XAG/USD – Daily Resistance & Support:
- Resistance: 15.70 / 16.00 / 16.75 / 17.75 / 19.00 / 20.00 / 21.00 / 22.00
- Support: 15.00 / 14.75 / 14.35
XAG/USD – Summary:
- Expected to commence a Bullish Corrective Structure in a three-swings sequence at or around the 15.00 Levels and possibly retest the 16.00 – 16.75 vibration zone.
- Bearish Impulse expected around the 16.00 – 16.75 vibration zone.
- If all scenarios would turn out to unfold as expected and Silver would retest the 14.35 levels, then that specific area could be seen by bulls as an opportunity for longs, which could even reach the 21.00 levels in an Impulse.
XAG/USD – Daily Interactive Chart
ENERGY
Crude Oil (WTI) – Elliott Wave Analysis
Crude Oil (WTI) – Daily Chart (picture)
Crude Oil (WTI) lost approx. $120 per barrel in value from 2008’s Recession until February 2016 when it finally gained Support around the 27.00 Levels.
The Bullish Structure leaves room to state that Crude Oil (WTI) could be trading within a Complex Structure as well.
The Bullish Sequence on Crude Oil (WTI) from the February 2016 lows and until January 2017 highs, has been Labeled as the Primary Wave W (purple), with a Running Flat in Intermediate (B) (green) and an Ending Diagonal in Intermediate (C) (green).
The 6 months of Bearish Correction which followed, has been labeled as a Double Three Pattern in Primary X (purple).
From June 2017, up until January 2018 Crude Oil (WTI) resumed the Bullish Cycle and unfolded a sustained Rally in Intermediate (A) (green), presenting an Extension in the Minor C (light blue) sub-wave.
Intermediate (B) (green) Corrective Structure started with February 2018, with what appears to be an ABC Minor Degree (red) Pattern. Within this structure, Minor B (red) surpassed the end of Intermediate (A) (green) and the start of Minor A (red), getting Resistance at the 100% Fibonacci Extensions of Primary W & X (purple). In doing so, it would lead Intermediate (B) (green) to be labeled either as a Running Flat or as an Expanded Flat type of Corrective Structure.
In a Running Flat scenario, Minor C (red) would not surpass the end of Minor A (red) and could find its end at or around the 60.50 Levels, where the 61.8% Fibonacci Extension of Primary W & X (purple) is located.
In an Expanded Flat Scenario, Minor C (red) would surpass the end of Minor A (red) and could find its end at or around the 58.00 Levels, where the 38.2% Fibonacci Retracement of Intermediate (A) (green) is located.
In a Bearish scenario which would include an Extension in the impulsive Minor C (red), if the Expanded Flat 58.00 Levels would also be broken, then this could leave Crude Oil (WTI) in a bearish zone, with a potential to reach 52.00 Levels as the next possible Support.
The preferred scenario would be the Running Flat, which would leave 60.50 as the levels in focus. Should Crude Oil (WTI) be able to gain Support there, then this would leave the overall pattern in the Bullish Intermediate (C) (green) position, which would be expected to be sustained and even present an Extension.
In a scenario where Intermediate (C) (green) would present the extension, Crude Oil (WTI) could rally towards 80.00 Levels but could also reach 90.00 or even 100.00 Levels.
Crude Oil (WTI) – Daily Resistance & Support:
- Resistance: 70.00 / 80.00 / 90.00 / 100.00
- Support: 66.50 / 60.50 / 58.00 / 52.00
Crude Oil (WTI) – Summary:
- Expected to complete the correction at or around the 60.50 Levels and resume the up-trend in an impulsive manner.
- If the Bullish Impulse will present an Extension, the swing could reach 80.00 Levels, but could also reach 90.00 or even 100.00 Levels.
- If a Bearish Breach of the 60.50 Levels would occur, then WTI could even reach the 52.00 Levels as the next bulls’ points of interest and vibration area.
Crude Oil (WTI) – Daily Interactive Chart
INDICES
Global Indices have been enjoying a full century of Bull Market.
The chart below can illustrate how Dow Jones Industrial Average performed over a period of 104 years, from 1914 up until 2018.
US Bull Market – Wave Count
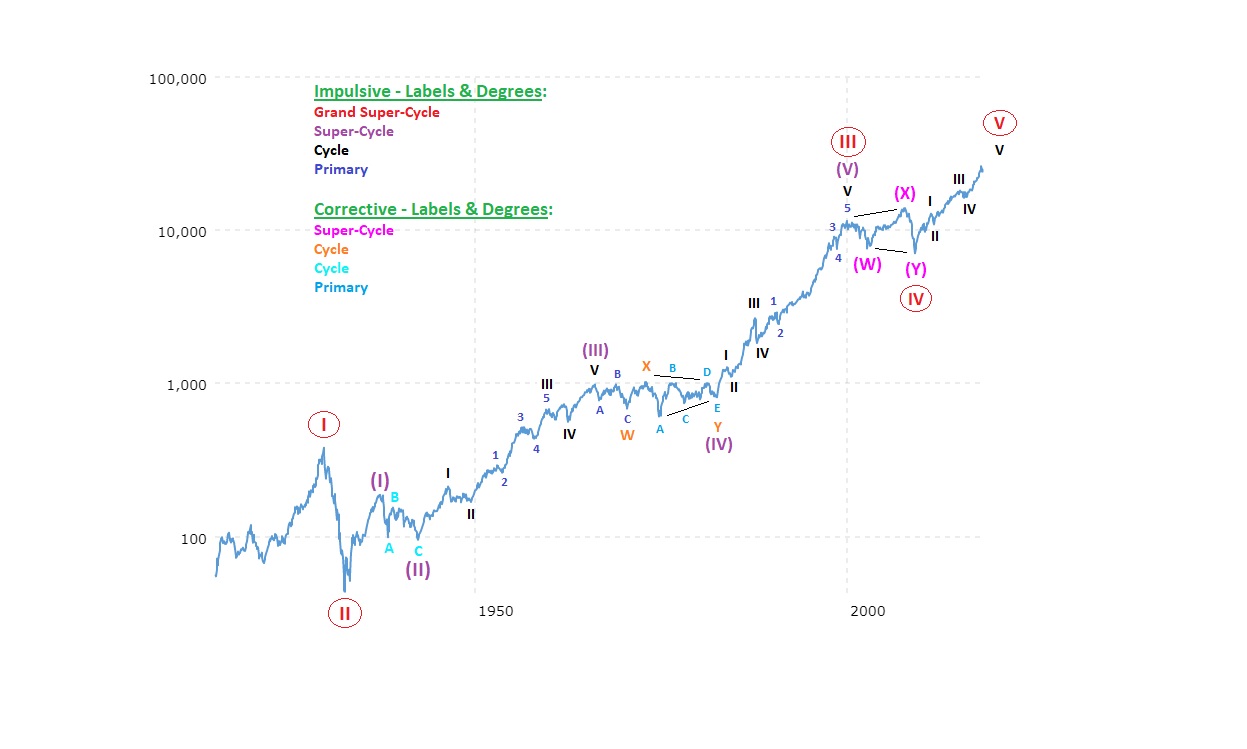
The period until 1929 has been labeled as Grand Super-Cycle I (red) and what followed after that was the historical Great Depression of 1930’s, labeled as Grand Super-Cycle II (red).
The Bull Market commenced after a long period of uncertainty and a sustained Rally has been witnessed in an Extension, up until 2000’s Dot Com bubble, where Grand Super-Cycle III (red) has been placed.
Grand Super-Cycle IV (red) has been labeled with Super-Cycles (W)(X)(Y) (pink), where Super-Cycle (W) (pink) reflects the Dot Com burst and bearish outcome, and where Super-Cycle (Y) (pink) represents the bottom of the 2008 Recession.
Since the latest great contraction in 2008, the Market has been continuing the Bull Market. This Bullish Impulse has been labeled as Grand Super-Cycle V (red).
Assuming the Bull Market has been correctly labeled, this would lead towards a full Grand Super-Cycle formed out of a five-wave sequence completing over the next two years or so.
If this would turn out to come true and another Market Contraction would be destined to happen, then the 2009’s lows for Dow Jones could be the next projected area for such big contraction.
However, before that, Dow Jones could still deliver a bullish Impulse to complete Cycle Wave I (black).
Going back on the VIX (Volatility Index) weekly chart, one could notice the correlations between the volatility spikes in the VIX and the contractions the Market suffered in 2000 and 2008.
VIX – Weekly Chart (picture)
The analysis presented in the lines to come paints a picture in which the US Indices are being labeled, on the lower timeframes, as Complex Corrective Structures within a Primary Degree Wave 4 (blue), within the main Impulse of Cycle Wave V (black).
A close-up on the VIX could indicate that the Market might be preparing for another spike in volatility, like the one experienced in February 2018.
VIX – 2H Chart (picture)
SNP500 – Elliott Wave Analysis
SNP500 – 4H Chart (picture)
US Indices and most of the other global Stock Exchanges enjoyed 2 years of constant up-trend and an overall Bull Market. From February 2016, up until February 2018, SNP500 rose approx. 1000 points, showing sustained rallies and shot-lived corrections.
Eventually, SNP500 peaked in February 2018, and right after that this Index lost approx. 350 points. That is when the VIX spiked and volatility came back, resulting in a decrease in investors’ complacency and leaving room for periods of uncertainty.
The All-Time-High created at the end of January 2018 has been labeled as Primary Degree Wave 3 (blue).
Since the start of the year SNP500 has been showing signs of weakness, unfolding with limited swings and basically trading within a bigger degree sideways structure.
The entire Sideways Correction has been labeled as Primary Degree 4 (blue) in a Flat Pattern.
Intermediate (A) (red) represents the 1st leg of the entire Intermediate Degree (A)(B)(C) (red) Correction, which would be necessary for the completion of Primary 4 (blue).
After Intermediate (A) (red) broke significant supports, Intermediate (B) (red) began correcting the 350 points fall. The Structure appears to be unfolding as a Complex Flat Correction.
Intermediate (B) (red) is composed out of a Complex Minor WXY (purple) Structure, with all Minor Waves (purple) showing themselves Complex Patterns with their Minutes WXY (pink) sub-waves.
Minor Y (purple) could have completed Intermediate (B) (red) at or around the 2825.00 Levels, where the 100% Fibonacci Extension of Minors W & X (purple) is located.
The 2825.00 Levels are considered to reflect a Vibration Zone, as that area is considered to reflect the February 2018 sell-off, and points of interest for the bears.
Minor Y (purple) has been developing its waves within a Rising Channel, under a Triple Three formation in its Minuette WXYXZ (pink) sub-waves.
Minute Z (pink) could be considered as complete, since it contains the necessary three-swings sequence in its Minuette sub-waves (orange).
However, the pattern in Intermediate (B) (red) could allow another bullish swing before Primary 4 (blue) would be finalized with another sell-off in Intermediate (C) (red), like the one witnessed in early February 2018.
The colored boxes represent different scenarios in which SNP500 could react and unfold its next decisive moves.
- Blue Box – In case of an overshoot and an attempt to tag the previous all-time high, the 2875.00 could reflect a strong resistance.
- Orange Box – Should the 2825.00 levels hold as the decisive resistance, then SPX could start unfolding a Bearish Impulse, along with the projected VIX spike.
- Red Box – In case of a bearish breach of the 2785.00 levels and the lower trend-line of the rising channel, then SNP500 could enter bearish territory.
Should the Flat Correction scenario turn out to be valid, then SNP500 would be left with Bearish Intermediate (C) (red), which could unfold with an aggressive sell-off, and with a sustained impulsive structure towards 2500.00 / 2475.00 significant Supports.
SNP500 – Resistance & Support:
- Resistance: 2835.00 / 2875.00 / 2920.00
- Support: 2785.00 / 2700.00 / 2600.00 / / 2500.00 / 2475.00
SNP500 – Summary:
- Expected to complete Intermediate B (red) correction at or around the 2835.00 Levels.
- Impulsive Bearish Wave expected to start at or around the 2835.00 Levels.
- If an overshoot and a Bullish Swing would occur, then a strong resistance could reflect the 2875.00 Levels.
- In case of an imminent spike in volatility and a massive sell-off to occur, then SNP500 could pose sharp losses even until the 2500.00 levels.
SNP500 – 4H Interactive Chart
DOW30 – Elliott Wave Analysis
DOW30 – 4H Chart (picture)
Dow Jones Industrial Average has been trading in a Bull Market for the past two years, in line with SNP500 and NAS100, but all global indices as well.
DOW30 found its top with the VIX spike back in Feb 2018, when it lost 3500 points in a very aggressive manner. The sharp sell-off has been labeled as Intermediate (A) (red) due to its three-swings sequence.
As the structure unfolded and swings occurred, it seems like DOW30 could be trading within a corrective pattern, due to its overlapping swings.
DOW30 has been labeled in a Primary Degree Correction, visible on the presented chart as Primary 4 (blue). Intermediate (A) (red) is being presented as a first main swing from a total of three swings, necessary to complete the Primary degree.
At these stages in the current corrective pattern, DOW30 could be trading either in a Contracting Triangle or in a Flat pattern.
Following the surprise drop, the structure has been labeled as a Contracting Triangle in Intermediate (B) (red), in which all Minor sub-waves ABCDE (turquoise) are correcting one another and leading to a conflict in corrections, thus unfolding as Complex Swings.
In such Contracting Triangle pattern, the focus would be turned towards the upper trend-line (black dotted), as Minor E (turquoise) is presenting the typical overshoot before a drastic change of directions would occur.
A medium-strength Resistance could reflect the 25425.00 levels, as Minor E (turquoise) could finalize around the area, in a preferred Contracting Triangle scenario.
The strongest Resistance seems to be located around the 26050.00 Levels, where the previous sell-off in Feb 2018 commenced. The mentioned levels reflect a vibration zone, as the 100% Fibonacci Extensions of Minors A & B (turquoise) seem to be located strategically in case of a Flat Correction as the real structure.
In a Contracting Triangle formation, DOW30 could be finalizing Intermediate (B) (red) around the 25425.00 levels, while in a Flat Formation DOW30 could be finalizing Intermediate (B) (red) around the 26050.00 levels.
The colored boxes represent different scenarios in which DOW30 could react and unfold its next decisive moves.
- Blue Box – In case of an overshoot and an attempt to tag the 100% Fibonacci lines in a Flat Pattern, the 26050.00 levels could reflect as a strong resistance.
- Orange Box – Should the 25425.00 levels hold as the decisive resistance in a Contracting Triangle, then DOW30 could start unfolding a Bearish Impulse, along with the projected VIX spike.
- Red Box – In case of a bearish breach of the 24900.00 levels, then DOW30 could enter bearish territory, and a bearish breach could indicate further down-side as an increased probability.
Should the Contracting Triangle scenario turn out to be valid, then DOW30 would be left with Bearish Intermediate (C) (red), which could unfold with an aggressive sell-off, and with a sustained impulsive structure towards 22750.00 / 22200.00 significant Supports.
DOW30 – Resistance & Support:
- Resistance: 25425.00 / 26050.00 / 26400.00 / 26700.00
- Support: 25225.00 / 24900.00 / 24300.00 / 24000.00 / 23450.00 / 22750.00 / 22200.00
DOW30 – Summary:
- Expected to complete Intermediate B (red) correction around the 25425.00 Levels.
- Impulsive Bearish Wave expected to start around the 25425.00 Levels.
- If an overshoot and a Bullish Swing would occur, then a strong resistance could reflect the 26050.00 Levels.
- In case of an imminent spike in volatility and a massive sell-off to occur, then DOW30 could pose sharp losses even until the 22200.00 levels.
DOW30 – 4H Interactive Chart
NAS100 – Elliott Wave Analysis
NAS100 – 4H Chart (picture)
Nasdaq has been rallying for the past two years, showing consistency in its swings, fueled by the “buy the dips” sentiment.
Like its fellow US Indices, NAS100 found its first top in February 2018, when volatility returned. In line with DOW30 & SNP500 sell-off, the tech sector has also shown a 875 points decrease in early February 2018.
NAS100 seems to be fueled by the buying euphoria more than the other US Indices, as since February 2018 it managed to rise towards fresh all-time-highs with each major rising swing.
While NAS100 has been creating new all-time-highs, DOW30 & SNP500 failed to do so, by presenting lower-highs and then higher-lows. These swings occurred during a period of contraction in the market, thus, it is to be mentioned that this could represent a divergence between the US Indices, one which could lead towards a stronger than expected bearish impulse.
NAS100 is presenting a different type of pattern, one in which new all-time-highs have been reached, but with corrective features reflecting.
The possibilities for the actual hidden pattern point towards an Expanded Flat as an interpretation. However, an Ending Diagonal would not be of the question.
In an Ending Diagonal scenario, NAS100 would be creating another all-time-high, while reaching the upper Rising Channel trend-line and possibly facing a Strong Resistance around the 7650.00 levels, which reflect the red-dotted trend-line and peaks.
The preferred scenario would place NAS100 in a scenario in which the pattern would reflect an Expanded Flat, this leading towards the possibility of a bearish outcome needed, for Primary 4 (blue) to complete.
NAS100 has been labeled as a Complex Pattern, with one structure in Intermediate (W) (purple) and another one in Intermediate (X) (purple), while Intermediate (Y) (purple) would remain as a pending swing.
Intermediate (W) (purple) was labeled as a Running Flat, while Intermediate (X) (purple) has been labeled as a Double Three within a Rising Channel, in which multiple complex swings occur and conflicts between corrections, in an overlapping manner.
Both Ending Diagonal & Expanded Flat scenarios would point towards Intermediate (Y) (purple), which could reflect major down-side in NAS100, possibly reaching even the 6100.00 levels.
The colored boxes represent different scenarios in which NAS100 could react and unfold its next decisive moves.
- Blue Box – In case of an overshoot and an Ending Diagonal scenario, the 7650.00 levels could reflect as a strong resistance.
- Orange Box – Should the 7500.00 levels hold as the decisive resistance in an Expanded Flat scenario, then NAS100 could start unfolding a Bearish Structure, along with the projected VIX spike.
- Red Box – In case of a bearish breach of the 7200.00 levels, then NAS100 could enter bearish territory, and a bearish breach could indicate further down-side as an increased probability.
Should the Expanded Flat scenario turn out to be valid, then NAS100 would be left with Bearish Intermediate (Y) (purple), which could unfold with an aggressive sell-off, and with a sustained structure towards 6350.00 / 6100.00 significant Supports.
NAS100 – Resistance & Support:
- Resistance: 7500.00 / 7650.00 / 7725.00 /7800.00
- Support: 7300.00 / 7200.00 / 6850.00 / 6600.00 / 6350.00 / 6100.00
Nas100 – Summary:
- Expected to complete Intermediate X (purple) structure around the 7500.00 / 7650.00 Levels.
- Impulsive Bearish Wave expected to start around the 7500.00 / 7650.00 Levels.
- If an overshoot and a Bullish Swing would occur in the Ending Diagonal scenario, then a strong resistance could reflect the 7725.00 Levels.
- In case of an imminent spike in volatility and a massive sell-off to occur, then NAS100 could pose sharp losses even until the 6100.00 levels.
NAS100 – 4H InteractiveChart
DAX30 – Elliott Wave Analysis
DAX30 – Daily Chart (picture)
DAX30, like most of the global Indices, has been trading within a Bull Market and an up-trend, ever since February 2016. The Bull Market trend has been labeled as Super-Cycle Wave (V) (black).
Bullish Cycle Wave I (green) began with early February 2016, covering 50% of the losses which occurred during 2015. This Bullish Swing was corrected by Cycle Wave II (green) with approx. 61.8% on the Fibonacci Retracements scale, also establishing a strong Support highlighted by the rising red trend-line.
The Bullish 5 Swings Sequence period between July 2016 and November 2017 represents the strongest up-trend and it has been labeled as Cycle Wave III (green). This Bullish Rally presents a classic Elliott Wave Extension within the Primary Wave 3 (blue) sub-wave.
Cycle Wave IV (green) commenced its Corrective Pattern in the beginning of November 2017 and ever since then, it has shown Complex Structures. From an Elliott Wave standpoint, the Complex Corrective Patterns could be occurring because of the alternations between corrective cycles, if one is simple then the other would unfold as complex, in this case between Cycle Wave II (green) and Cycle Wave IV (green).
According to the current Wave Count, Cycle Wave IV (green) could be unfolding as a Complex WXY (purple) Primary Waves.
Primary W (purple) began the Bearish 3 Swings Sequence with Intermediate (A) (orange), which was followed by Intermediate (B) (orange), with a Complex Structure as well, due to the conflict between corrections and degrees.
Intermediate (B) (orange) finalized with DAX30 hitting a fresh all-time-high around the 13590.00 Levels.
The reaction at the 13590.00 Levels was instant. With VIX spiking, DAX30 lost approx. 1600 points in just one week. This Impulsive Bearish leg has been labeled as Intermediate (C) (orange), thus completing Primary W (purple).
Primary X (purple) unfolded as well with a 3 Swings Sequence, with a Leading Diagonal in Intermediate (A) (orange), a false break-out during its Intermediate (B) (orange) and an impressive Bullish Intermediate (C) (orange) wave. On the Fibonacci Retracement scale, Primary X (purple) managed to cover 78.2% of the entire losses caused by the VIX spike.
This Complex Pattern involves combinations of structures, hence the reason why Primary Y (purple) would not be out of the question.
Within Primary Y (purple), Intermediate (A) (orange) reversed sharply on the down-side and after that a correction began in Intermediate (B) (orange). The correction unfolded within a Rising Channel and the continuation levels for Impulsive Bearish Intermediate (C) (orange) reflected the 13150.00 Levels.
Impulsive Bearish Intermediate (C) (orange) would be expected to continue the projected sell-off, if the VIX would spike again. Should this turn out to unfold as expected, then DAX30 could even create a new yearly low, so it could complete the pattern, and aggressively test the Strong Support trend-line (red).
Fibonacci Extensions of 23rd January 2018 and 26th of March yearly low are pointing towards the 100% measurements, which reflect the 11600.00 Levels, and an area which could be subject to a strong support.
Should DAX30 deliver the expected Bearish Impulse, then that would complete Primary Y (purple), but also the entire Cycle Wave IV (green), which would result in DAX30 possibly continuing with Cycle Wave V (green).
Cycle Wave V (green) would be expected to get Resistance at or around the 261.8% Fibonacci Extension of Primary Waves 1 & 2 (blue). The 14400.00 Levels also appear to be lining up with the 61.8% Golden Ratio and Fibonacci Extension of Cycle Wave III & IV (green).
DAX30 – Daily Resistance & Support:
- Resistance: 12850.00 / 13000.00 / 13650.00 / 13950.00 / 14400.00
- Support: 12450.00 / 12000.00 / 11850.00 / 11650.00 / 11350.00
DAX30 – Summary:
- Expected to continue the Bearish Sequence towards the 11850.00 – 11650 area.
- If Bearish Impulse would be delivered, a Support is expected to occur around 11650.00 or 11350.00, which could send DAX30 on a Bullish Impulse towards the 13650.00 or even 14400.00 Levels.
DAX30 – Daily Interactive Chart
Dear friend and trader,
Thank you for taking the time to go over the presented material.
Hopefully it will be useful to you when charting, or would be of assistance when you’re about to make an important trading decision.
Many pips ahead,
Richard